


Here at Pitcher List, we have a suite of PLV metrics to analyze every pitch in a baseball game. Decision Value (DV) is our hitter swing decision metric. It takes inputs like pitch velocity, location, and movement, and tells us whether the hitter made a good decision to swing or take a particular pitch. This isn’t quite as simple as plate discipline; swinging at a Logan Webb sinker and pounding it into the ground is a bad outcome even if the pitch was a strike.
Instead, Decision Value rewards hitters for swinging at pitches they should be able to hit hard, and for taking pitches they’re unlikely to do much with. The flipside is that Decision Value punishes hitters if they don’t swing at pitches they should be doing damage on or do swing at pitches that are unlikely to generate quality contact. You can find a much more thorough introduction to PLV metrics and Decision Value here.
One of the advantages of pitch-level metrics is that we get data more quickly than metrics based on batted balls or at-bat level outcomes. PLV Decision Value tends to stabilize at around 400 pitches, which means we can start making reliable inferences about hitters’ decisions around when they hit the 100 plate appearance mark. That’s a particularly appealing feature for studying rookies who are missing the MLB track record that veterans have. Let’s look at six of our higher-profile rookie hitters and see what we can glean from their approach at the plate.
Sal Stewart – 111 DV, 105 zDV, 103 oDV
Stewart started the season on an absolute tear, hitting .281/.373/.570 through the end of April. While he’s slowed down as the season has continued, Stewart has continued to make excellent decisions at the plate.
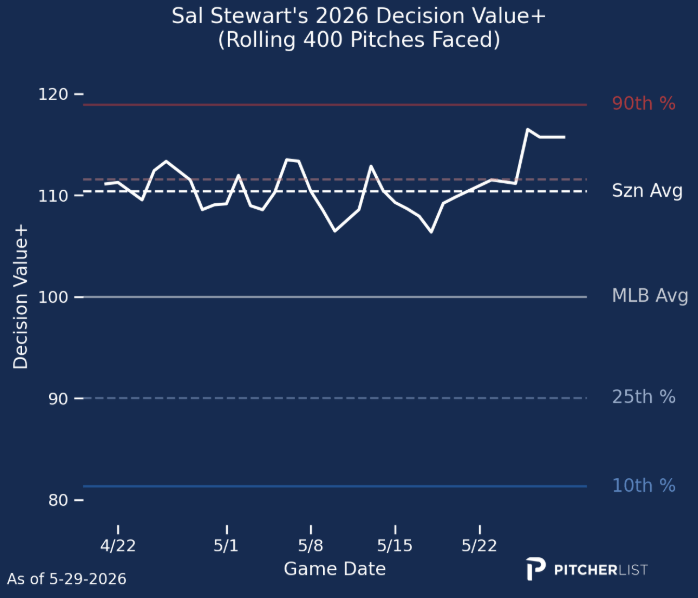
Stewart has cut his overall swing rate a bit relative to his cup of coffee in 2025. He’s chasing four percentage points less at a slightly-above-average 28.6% rate. He swings at pitches in the zone 70.3% of the time, giving him a strong 41.7% split in swing rate. The combination of good decisions both in and out of the zone has led Stewart to a very solid 12.5% walk rate and 20.4% strikeout rate.
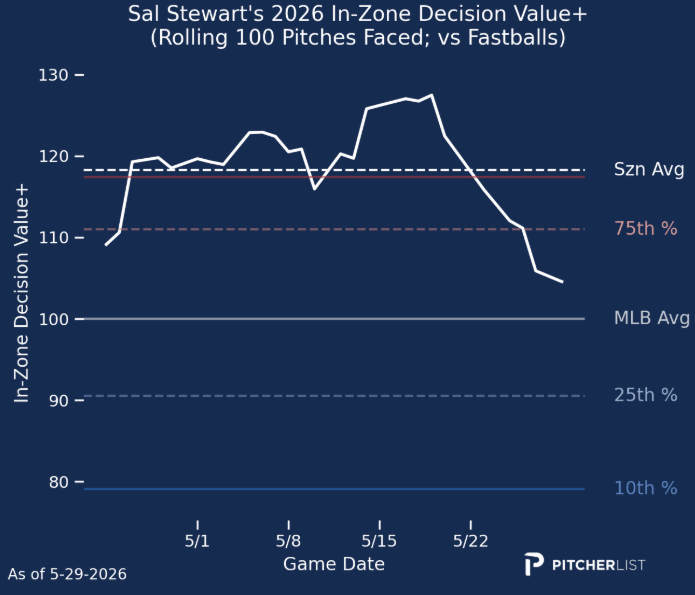
Stewart has particularly feasted on fastballs this year, hitting .307 with a .567 slugging percentage against heaters. He’s been aggressive when facing fastballs, swinging at 54% of four-seamers, 51% of sinkers, and 59% of cutters he’s seen. Aggression tends to be rewarded by zDV and penalized by oDV, and Stewart is no different. He’s posted an excellent zDV, over 120 for most of the season, and a poor oDV, hovering around 80, against fastballs. Of late, Stewart’s zDV against fastballs has ticked down, and his oDV has ticked up, signs that he might be getting a little passive against the type of pitch he hits best.
Konnor Griffin – 79 DV, 87 zDV, 94 oDV
Griffin has been one of the most exciting prospects to debut in years. Hyped as a generational talent, he’s mostly lived up to those expectations. Despite just turning 20 years old in late April, Griffin has managed a slightly above average .270/.327/.402 line through his first 51 MLB games. Griffin has shown excellent bat speed (75.5 mph) when swinging, but still has some progress to make in determining what to swing at.
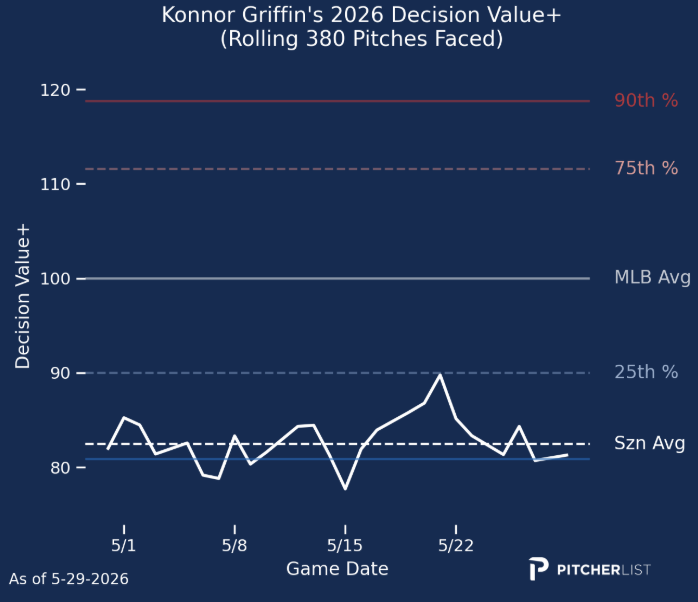
Griffin has a below-average 79 PLV DV and ranks below average in both DV component stats, zDV and oDV. Griffin tends to the aggressive side at the plate, but not unreasonably so, ranking 39th of 164 hitters in swing percentage. He swings a bit less often than Bryce Harper, for example, despite seeing about 4.5 percentage points more pitches in the zone. It’s the choice of what to swing at that’s been limiting Griffin’s production. Griffin chases 37.2% of the time, about 7 percentage points more often than the league average. Griffin swings at pitches in the zone at a league-average rate, but appears to be choosing the wrong pitches to attack, yielding an 87 zDV.
Griffin has particularly struggled against offspeed pitches, hitting .115 with a .192 slugging percentage. In an exceptionally small sample (97 offspeed pitches seen), the issue is mostly swing decisions against offspeed strikes. He’s taking balls at a good rate, actually showing above-average oDVs against changeups, but has a much poorer zDV on these pitches. These are tiny samples, though, and definitely not enough data from which to draw firm conclusions. In a much larger sample of fastballs, Griffin has generally made decent decisions with a few lapses. He generally doesn’t chase fastballs, generating oDVs above the league average for most of the season. In the zone, he’s streakier with his decision-making. He’s spiked his rolling zDV against fastballs up to league average twice, in the games leading up to May 8th and May 22nd. The second of these spells is interesting to me, as the 11 games between the two spikes yielded just one walk on May 10th. My interpretation of the DV data is that Griffin should be more aggressive in the zone against fastballs.
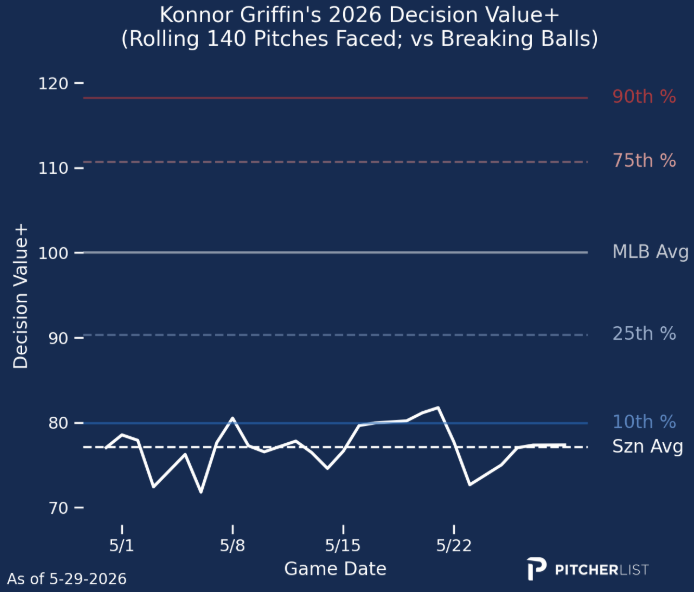
It’s Griffin’s decisions vs breaking balls that have let him down. He’s hitting .231 and slugging .338 against breaking balls. While his exit velocity and launch angles are actually better against pitches that bend, it’s also coming with a 38.8% whiff rate. Still, Griffin has been a slightly better-than-average bat in MLB at age 20 despite his swing decisions. Improvement in what he chooses to swing at, combined with his excellent bat speed and 99th percentile legs, should lead to explosive outcomes as he matures.
Travis Bazzana – 124 DV, 103 zDV, 110 oDV
I wrote more about Bazzana last week as he’s one of the few hitters who combine below-average swing aggression and above-average zDV. He’s a swing decision monster, nearly two standard deviations above league average in his overall DV. That skill has eroded over time in the majors, though.
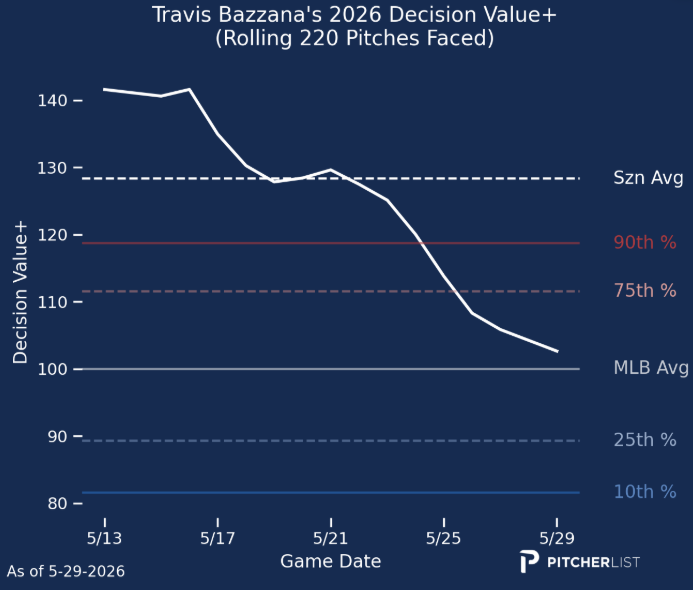
Over his past 53 plate appearances, dating back to May 20th, Bazzana has only 2 walks. In that time, his 3.8% walk rate has been paired with a 22.6% strikeout rate, both notably worse than his season averages. Bazzana has still maintained a .260/.283/.480 line over that stretch, though, which is still 7 percent better than league average.
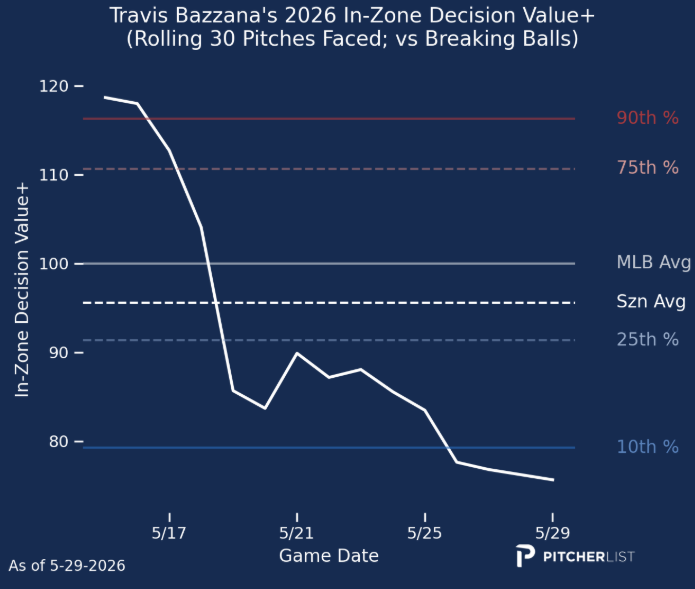
Bazzana has had excellent results against breaking balls this year, hitting .364 and slugging .485 against them. His expected stats are significantly worse, though, at .250 and .368, respectively. His elite decision-making has particularly suffered in a small sample against curves. He’s chased 40% of the time against curves while swinging at only 43.8% of curves in the zone. Against sliders, he’s only chased 16.4% of the time while swinging in the zone 51% of the time. Bazzana’s excellent results against breaking balls might be a small sample mirage. He only has a 25% hard-hit rate against breakers, and his decision-making has eroded over time. We can expect a little improvement against fastballs based on his expected statistics, but I’d be expecting a bit of regression here.
JJ Wetherholt – 114 DV, 97 zDV, 107 oDV
Wetherholt combines near-average swing decisions inside the zone with above-average chase avoidance. That combination yields an overall DV that is one standard deviation better than league average. Statcast agrees, with almost all metrics they track showing up in varying shades of red.
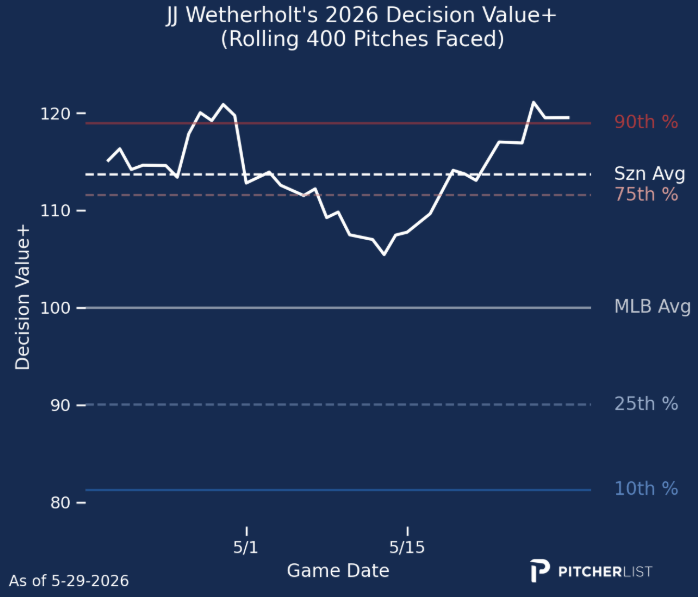
Wetherholt is hitting a solid .249/.357/.400, which feels light given his outstanding plate approach and strong contact ability. Still, it’s a line that’s 19 percent better than league average by wRC+. Wetherholt isn’t the most aggressive inside the zone, swinging at 65.7% of strikes. He has excellent discipline, though, chasing just 22.6% of the time.
Wetherholt is also remarkable for how well he handles pitches of all types. The main distinction between pitch types is how hard he hits fastballs. Wetherholt is averaging 94.9 mph exit velocity on four-seamers, good for a 56.4% hard-hit rate and a 20% barrel rate. The exit velocity combined with a 26.2 degree average launch angle on four-seamers has given Wetherholt a .253/.371/.600 line on the pitch. Wetherholt has also had much more success against curves (.718 OPS) than sliders (.535 OPS), but I wouldn’t expect that to continue. He’s maintained a 62.5% hard-hit rate against sliders with a 20.2 degree average launch angle. Instead, against curves, Wetherholt has only managed a 30.8% hard-hit rate and a 5.4 degree average launch angle.
Samuel Basallo – 68 DV, 91 zDV, 87 oDV
Basallo is up there, uh, hacking. Basallo’s 68 DV is a full two standard deviations below league average. It hasn’t affected him too badly thus far, though, as he’s currently sitting at a .276/.342/.500 slash line.
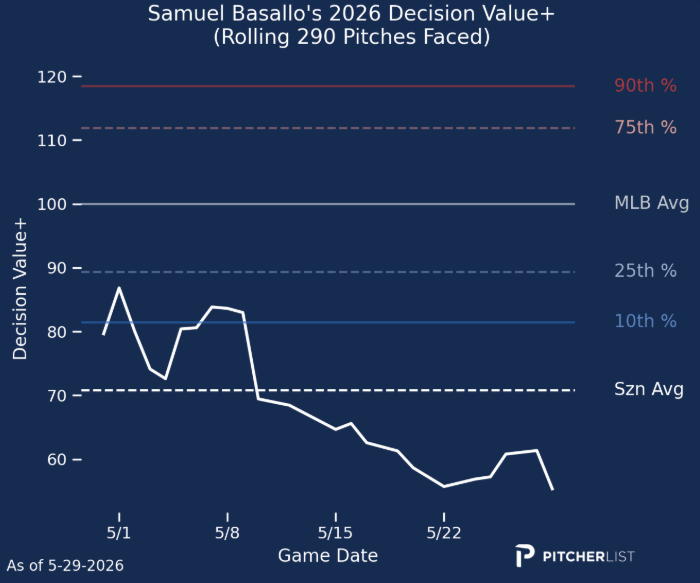
Basallo was much hotter in May than in April, despite the decline in his swing decisions. He’s chased 38.5% of the time this season and only swung at 67.5% of strikes. He’s been most successful against fastballs, hitting .301 and slugging .589, with expected statistics in agreement, against fastballs of all types. While he’s been worse against offspeed and breakers, it’s not that he’s been bad against soft stuff, hitting .258 and slugging .435. That’s in stark opposition to his swing decisions, though.
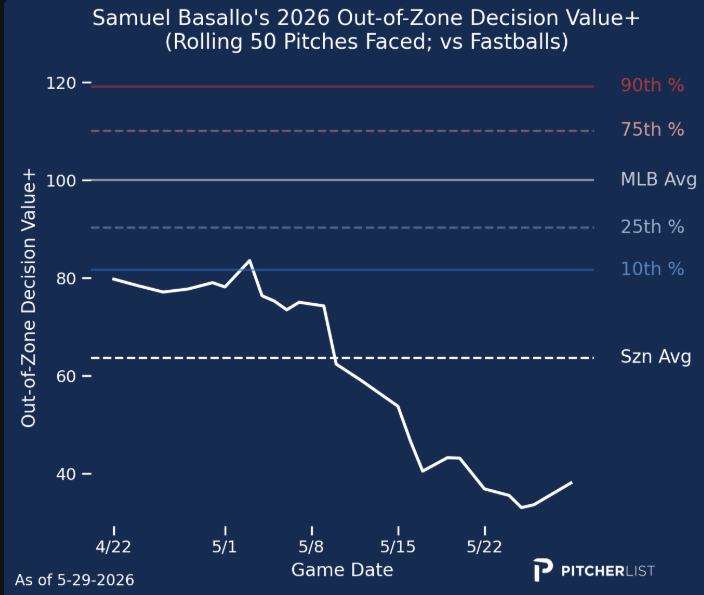
Basallo has shown an extreme proclivity to chase fastballs out of the zone (48.2% against four-seamers). His decisions against fastballs are basically the only reasons he has a poor overall DV on the season. Both his breaking ball and offspeed DVs sit around 90 – still below average, but much closer to the norm.
Are Basallo’s swing decisions a cause for concern? He’s making contact against 78.4% of four-seam fastballs despite his massive chase rate, while his overall contact rate is just 72.3%. His four-seam contact is loud, too, with a 60% hard-hit rate. He could probably benefit from a better approach against the most thrown pitches in baseball, but he also may be benefiting from constantly swinging at the pitches he can handle best.
Kevin McGonigle – 131 DV, 101 zDV, 114 oDV
McGonigle is another swing decision monster, posting a DV that’s a full two standard deviations above league average.
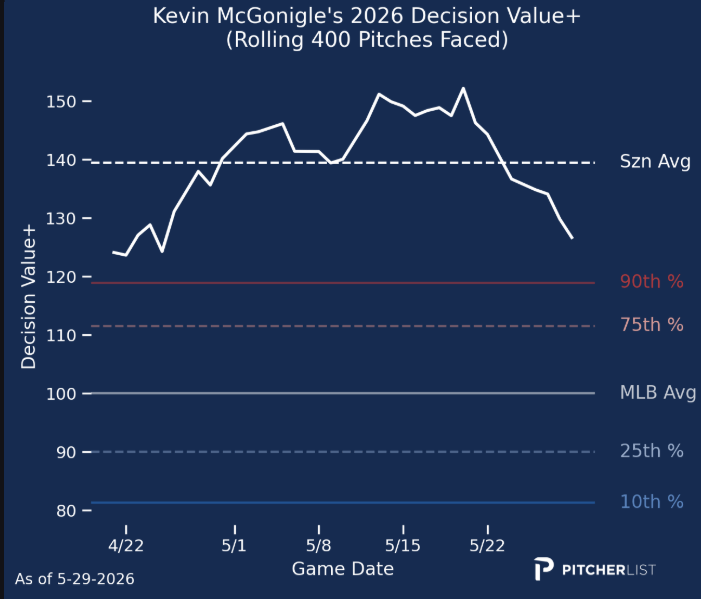
He’s succeeding by virtue of his excellent contact ability and swing decisions. Despite a 39th percentile bat speed and a 33rd percentile hard-hit rate, McGonigle ranks in the 88th percentile in squared-up percentage. The combination of excellent plate skills has led to a .288/.390/.412 line, 30 percent better than league average by wRC+.
McGonigle’s line is buoyed by his excellent ability to avoid strikeouts and draw walks. He’s walked on 13.6% of his plate appearances this year while striking out only 13.3% of the time. He doesn’t swing particularly often, only 41.7% of the time, but he has an excellent in-zone vs out-of-zone split (19.3% vs 65.8%). He’s consistently difficult to fool against any pitch, too. He doesn’t chase more than 30% of the time against any pitch type. He’s particularly good at spitting on breakers out of the zone, chasing just 13.8% of the time against curves and sliders, good for a 135 oDV against these pitch types.
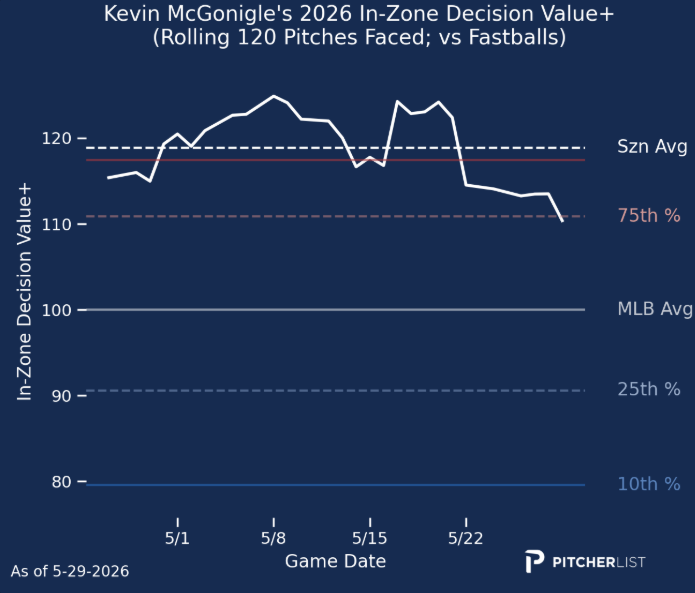
McGonigle has done his damage on fastballs, hitting .324 and slugging .469 against them. Statcast thinks there’s some hidden upside here, too, giving him a similar .316 expected average but also a .534 expected slugging. He swings at fastballs about 70% of the time they’re in the zone and handles four-seamers particularly well. He hits the ball hard about 43% of the time against four-seamers and sinkers vs a 37.5% overall hard-hit rate. He elevates four-seamers with a 26.3 degree launch angle, leading to a 15.8% barrel rate. McGonigle doesn’t have outstanding power, but the rest of the package is so elite that you’d expect what he does have to play up in games, thanks to his consistently excellent approach and contact ability.
Photos by Joe Robbins/Icon Sportswire & Mike Carlson/MLB Photos) | Designed by Aaron Asbury (@aarongifs on Instagram)
