






Here at Pitcher List, we have a suite of PLV metrics to analyze every pitch in a baseball game. Decision Value (DV) is our hitter swing decision metric. It takes inputs like pitch velocity, location, and movement, and tells us whether the hitter made a good decision to swing or take a particular pitch. This isn’t quite as simple as plate discipline; swinging at a Logan Webb sinker and pounding it into the ground is a bad outcome even if the pitch was a strike.
Instead, Decision Value rewards hitters for swinging at pitches they should be able to hit hard, and for taking pitches they’re unlikely to do much with. The flipside is that Decision Value punishes hitters if they don’t swing at pitches they should be doing damage on or do swing at pitches that are unlikely to generate quality contact. You can find a much more thorough introduction to PLV metrics and Decision Value here.
In today’s edition of PLV DV Weekly, we’ll be highlighting the best swing decision-makers at every position. With the 96th MLB All-Star Game happening next week in Philadelphia, we should check in on who is making elite swing decisions and how much the rosters overlap. I’ll only build one roster here since this squad isn’t playing anyone else. I’m also restricting myself to players who have seen at least 1,000 pitches this season to avoid small-sample wonders.
C: Will Smith, Los Angeles Dodgers (120 Decision Value)
I lied to you immediately. For the purposes of selecting a catcher, I decided to lower the pitches seen threshold to 800. Only six players who primarily play catcher have seen 1,000 pitches. Lowering the threshold to 800 more than doubles the available pool of players. Smith is currently on the IL with a neck injury, but hasn’t performed to his usual standards while he’s been in the lineup. Smith’s swing decisions aren’t slumping, though. He’s walking a strong 11.4% of the time while only striking out 16.9% of the time. Those are both down about 3 percentage points from last year. Smith’s PLV DV is down a tad too, which is a little surprising. The 2025 version of Smith was remarkably passive at the plate, swinging at only 38.8% of pitches. That would rank 145th of 150 qualified hitters this season. This year, Smith has chased about 2 percentage points more often, but added 5 percentage points to his zone swing rate. Combine that with career-high line drive and barrel rates, and I’m buying a big Smith second half.
1B: Spencer Torkelson (120)
Tork is the first of two Tigers on this list, with Gleyber Torres missing out due to an oblique injury keeping him under our playing time threshold. Torkelson is slashing .214/.313/.411 through 90 games, leaning on his plate discipline to make up for his poor batting average. Torkelson has cut his chase rate to a strong 21.9%, and swings in the zone at a 64.4% rate. While his overall zone swing rate is down a point and a half from 2025, he’s actually swinging more often at pitches in the heart of the zone. Despite the mostly positive changes in his plate approach, Torkelson’s strikeout rate has surged this year. After striking out in 25.7% of his plate appearances over his first four seasons in the majors, Torkelson is now striking out almost a third of the time. The culprit is a slide in Torkelson’s contact rate. Early in his career, Torkelson made contact on 56% of pitches he chased. Over the last two years, he made contact on 48% of pitches he chased. This year, his chase contact rate is down to 39.8%. Combined with a small decline in his zone contact rate, Torkelson’s swinging strike rate is up 2 percentage points to a career-high 12.4%.
2B: Xavier Edwards (123)
Edwards is having an excellent 2026, slashing .300/.385/.423 for a 122 wRC+. While his double-play partner Otto Lopez made the roster for the real thing, Edwards has shown superior swing decisions. Edwards ranks in the 94th percentile in strikeout rate (12.1%) and the 85th percentile for walk rate (12.6%), making him one of just 8 qualified hitters who walk more than they strike out. Edwards has also added a bit of pop this year thanks to a (still very slow) bat speed that has increased 4 MPH since 2024. Edwards has had success by massively cutting his swing rate from 47.7% in 2025 to 40.8% this year. More of the change has come from pitches inside the zone (6.3 percentage points), although Edwards has also cut his chase rate by 3.4 percentage points. Edwards has cut his zone and overall swing rates against every pitch type he’s seen this year. Despite that, his zDV is practically unchanged at 99, down from 101 last year. That means he’s still targeting the better pitches to hit, and not watching a ton of meatballs.
SS: Kevin McGonigle (134)
McGonigle is our second Tiger and the first player to make the MLB All-Star game. McGonigle is another one of the 8 batters with more walks than strikeouts, with his outstanding 14.8% walk rate leading him to a .287/.398/.423 line. McGonigle only chases 17.9% of the time, ranking in the 99th percentile for chase rate. He also swings in the zone 67.8% of the time, giving him an outstanding 50% zSwing-oSwing.
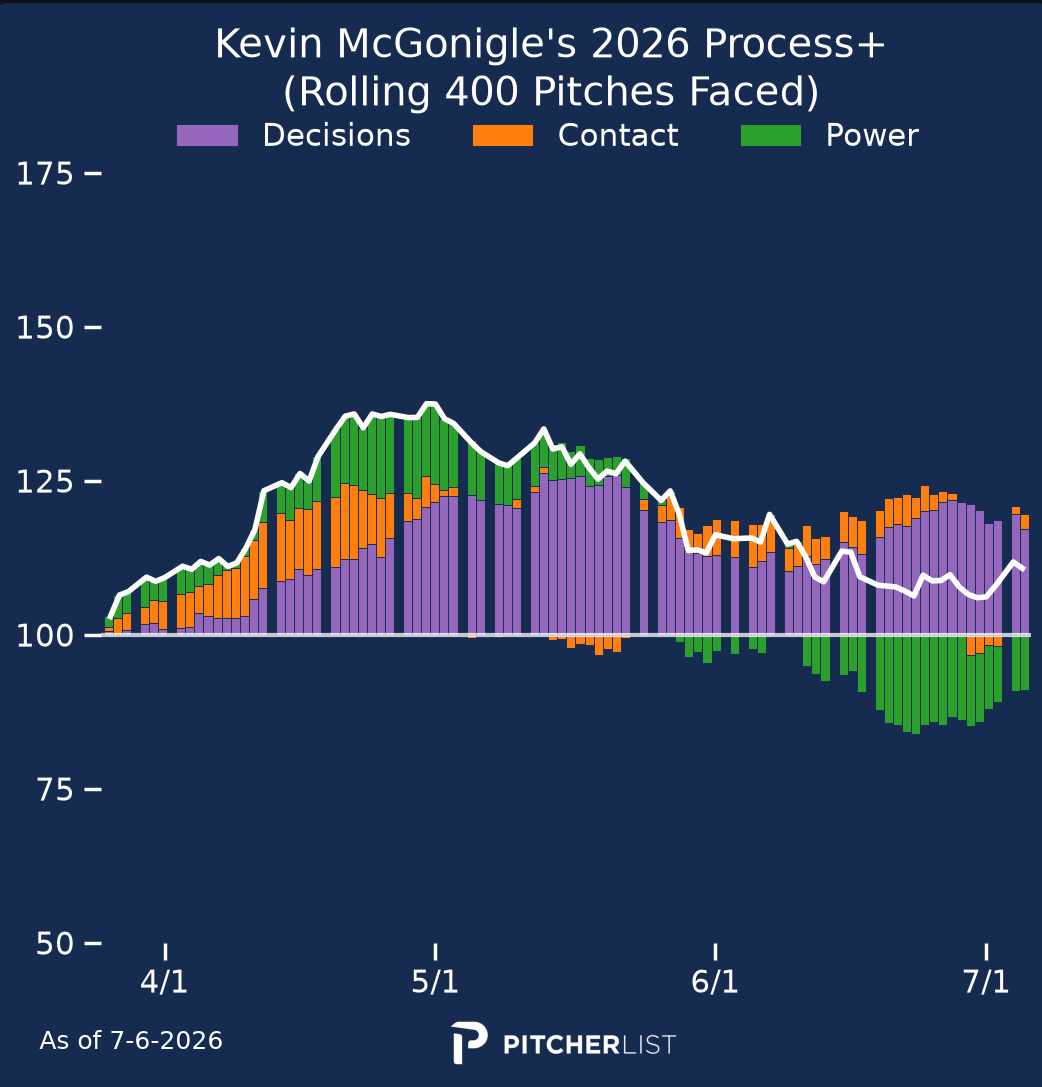
McGonigle’s power and contact abilities have fluctuated over the course of the season, but his swing decisions have remained consistently outstanding. It’s not like we’re breaking any news here, McGonigle is a terrific hitter. If the soon-to-be 22 year-old adds a little more consistent pop as he ages, this will be the first of many all-star games.
3B: Miguel Vargas (132)
Perhaps the breakout hitter of the year, Vargas has maintained his excellent plate approach. Vargas is one of just 15 hitters who have seen 1,000 pitches to post above-average marks in both zDV and oDV. His overall DV ranks second in the majors behind McGonigle. Like McGonigle, he has an excellent split in his zone swing and chase rates. Vargas chases only 20.6% of pitches outside the zone while swinging at 68.4% of strikes. Vargas has added 3.5 MPH of bat speed this year and has already eclipsed his 2025 total of 38 barrels. Vargas ranked second among third baseman at this point last year. With his newfound bat speed, excellent approach, and strong contact ability (83.3% contact rate), Vargas should be a fixture in the heart of the White Sox lineup for years to come.
LF: Taylor Ward (130)
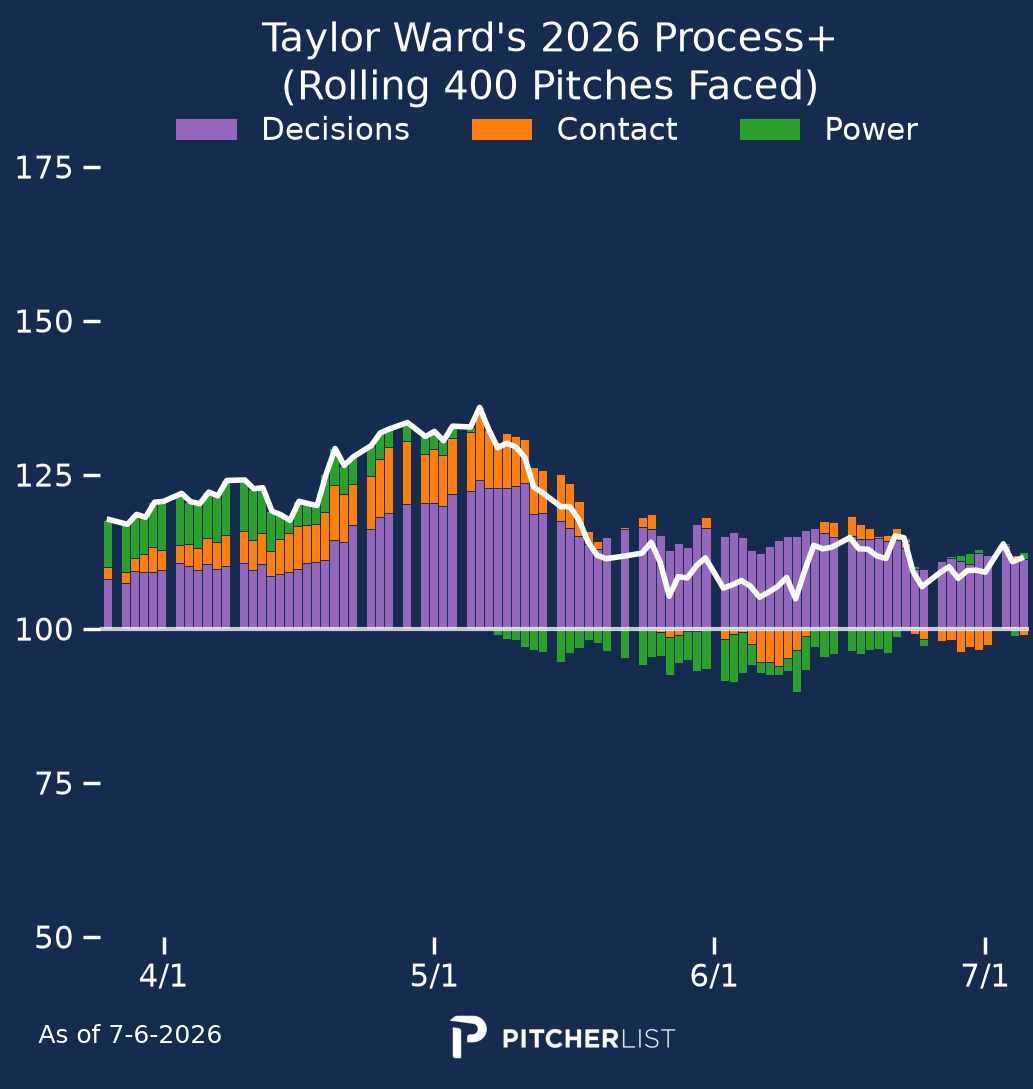
I don’t think anyone saw this type of season coming for Ward. It’s not that Ward’s been bad or off-the-charts good. He’s got a 115 wRC+, within 2 points of his career line. It’s that he’s stopped swinging entirely. After a decline in his swing rate to a career-low 37.6% in 2025, Ward has doubled down in 2026. He’s swinging only 34.7% of the time. That’s the lowest swing rate of any player over the past 5+ seasons (2021-26). Low swing rates are not inherently bad – 2021-25 Juan Soto takes up 5 of the bottom 8 spots – but it’s definitely a remarkable pivot for Ward. There are signs that Ward is returning to his previous ways, though. Since the start of June, Ward has swung at 43.4% of pitches and walked 10.9% of the time. A 43.4% swing rate would be very normal for pre-2025 Ward, and a 10.9% walk rate is still quite strong. The increased swing rate has led to 3 of his 5 home runs in roughly a third of his plate appearances, so we might be getting the return of some of the power Ward showed in previous seasons.
CF: Evan Carter (126)
Carter is a puzzling player. He’s picking his spots well and has generally strong plate discipline. He doesn’t chase much, only 19.6% of the time, and swings in the zone at 61% of pitches. Both of those numbers are typical of productive players. Those skills have nevertheless led him to a .186/.301/.333 line. His contact rate isn’t exceptional at 74.9%, but his zone contact is 84.7% and making contact in the zone is generally much more important than making contact at pitches you’re chasing. My working theory is that Carter suffers from hitting a lot of batted balls at the extremes of the launch angle distribution.
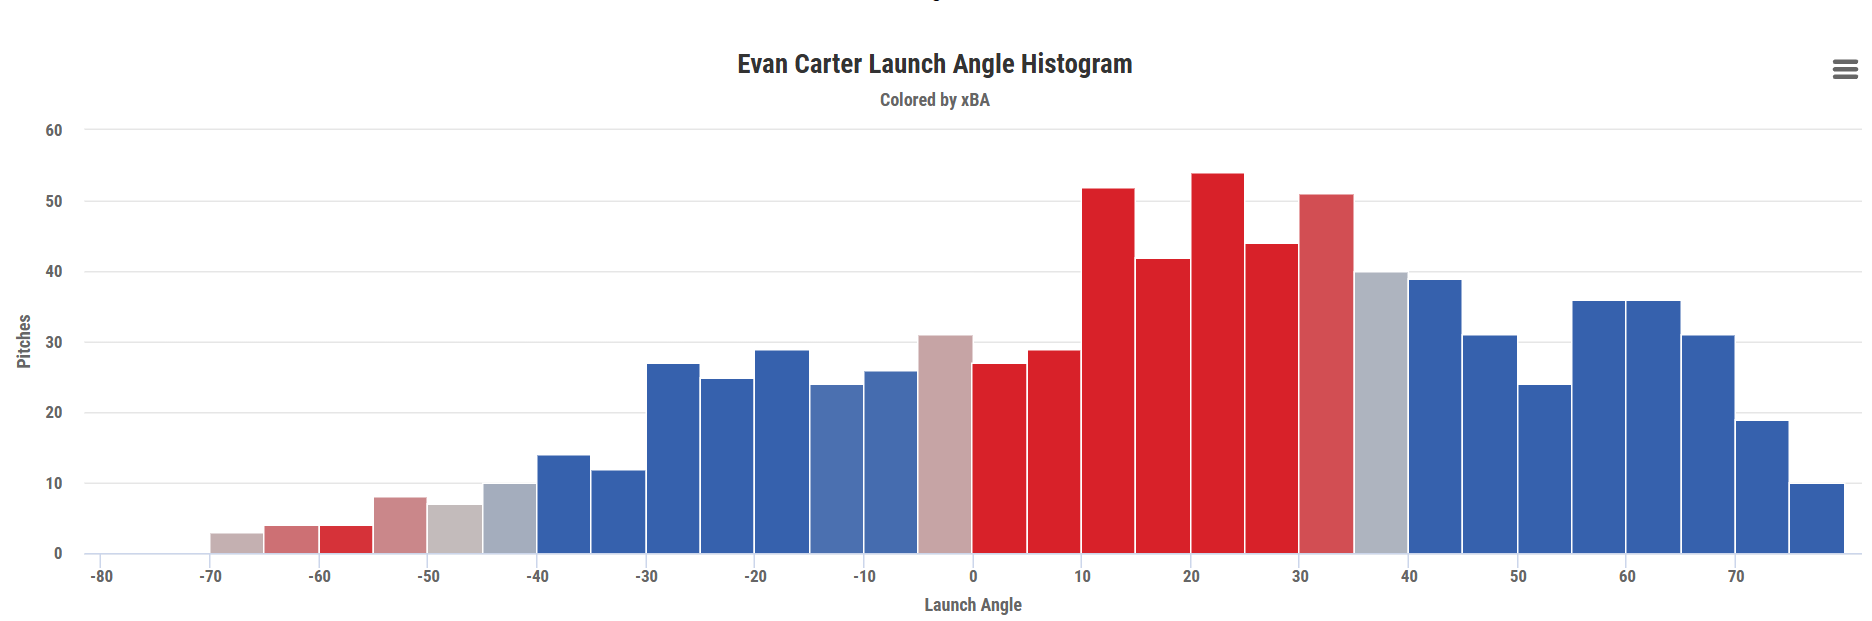
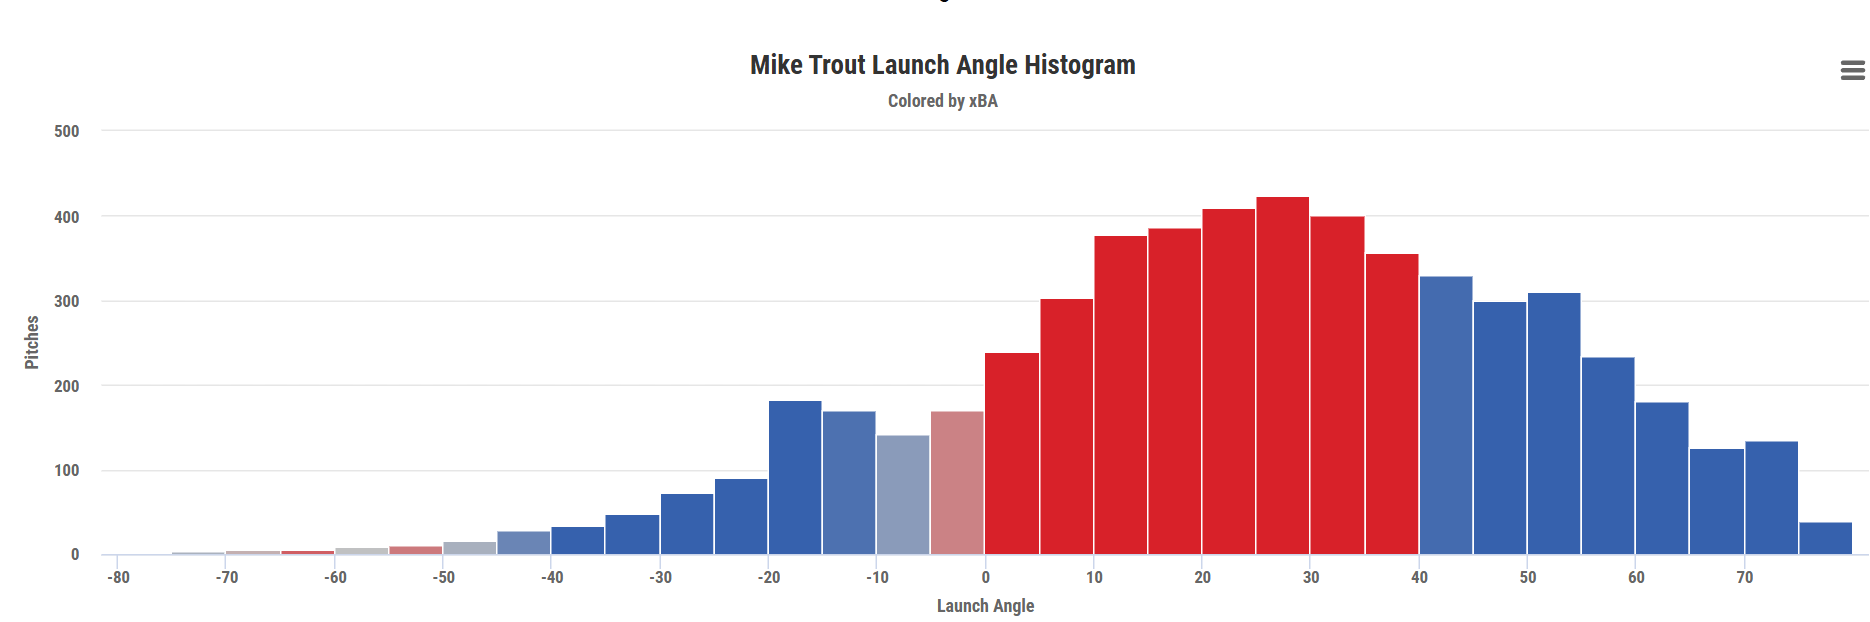
Mike Trout has almost identical zSwing and oSwing rates to Carter. While he makes contact more often, he’s not a premium contact bat like Steven Kwan or Luis Arraez. Setting aside any differences in bat speed or exit velos, what Carter does worse than Trout is have much fatter tails in his launch angle distribution. Batted balls with a launch angle of 60 degrees are pop-ups and easy outs. Batted balls with a -30 degree launch angle are choppers and generally routine groundouts. While Carter has excellent decision-making at the plate, his bat skills are letting him down when it comes to striking the ball at angles which are likely to produce hits.
RF: Austin Martin (128)
The one-time top prospect has been a league-average performer at the plate this year, hitting .248/.356/.327 in 267 plate appearances. His line, good for a 99 wRC+, is being carried by an OBP that rests on a 12.7% walk rate. Martin posted an excellent 124 DV in both 2024 and 2025, and he’s improved a bit this season. I’ve written about Martin before, but the short version is that he excels at attacking pitches in the middle of the zone without chasing. He doesn’t have impressive bat speed, but he gets the most out of his contact with an excellent 33.6% squared-up rate.
DH: George Springer (128)
It’s been a tough season for Springer thus far, but there are signs of life. With Springer restricted to DH only these days, for him to contribute value to the team, he needs to get it done at the plate. Springer’s June OPS was .738, his highest monthly OPS of the season, leaving his line at a rough .221/.308/.373. One thing working in Springer’s favor is that he has still been making his customarily excellent decisions at the plate. While his 128 DV isn’t quite the 138 he posted in 2024 or the 133 in 2025, it’s still nearly two standard deviations better than the average hitter. Springer’s chase rate is up to 25.2% this year, but he still swings at nearly 50 percentage points more strikes than balls. He’s lost a tick of bat speed relative to 2025, but is still swinging harder than he did in 2024. Springer’s excellent 2025 was driven in large part by an increase in his average launch angle to 17.3 degrees. His launch angle this year is back down to 13.2 degrees, closer to his 11.9 degree career average, and it’s cost him half of his barrel rate from last year. It’s not clear to me that Springer will get back to his 2025 level; that’s the only season since 2021 that Springer has hit the ball at a higher launch angle than 13.8 degrees. While Springer might get a little positive regression in his batting average, I’m taking under 20 homers for the season.
Photos by Joe Robbins/Icon Sportswire and Joe Robbins/Icon Sportswire | Featured image by Ethan Kaplan (@djfreddie10.bsky.social on Blue Sky and @EthanMKaplanImages on Instagram)
