


Now that 2020’s over, here’s a quick question: which player was more valuable for your teams: Maikel Franco (60 G, 243 PA, 9 HR, 23 R, 38 RBI, 1 SB) or Aaron Judge (28 G, 114 PA, 8 HR, 23 R, 22 RBI, 1 SB)?
The top earned-value tools — the FanGraphs Auction Calculator, the Razzball Player Rater, and the ESPN Player Rater — all point toward Franco. He was one of nine players this year to start every game for his team, so it’s no surprise that he ranks highly. If you’ve spent any time working with these tools, you’ll notice they always have something in common: the top players always play the full season.
This isn’t obviously a problem. You want the guys you roster to play, right? Christian Yelich’s knee injury last year no doubt cost thousands a shot at their head-to-head playoffs.
But follow that line of thinking for even a moment and issues crop up. When Juan Soto and Ronald Acuña Jr. sat out early in the year, any responsible fantasy player placed them on the IL and started someone else. Same for Judge. None of the big earned value lists account for this: they pretend that you’d just keep an injured player in your lineup and take zeroes until they return.
I’ve previously written about this issue on multiple occasions, and I recommend you glance over these pieces if you’d like some more context:
- “Everything Wrong With the ESPN Player Rater” goes into detail about how ESPN misses the mark. Long story short: they include every MLB player to calculate their values, which massively inflates the value of saves and steals, and they don’t issue positional adjustments. It’s all kinds of bad. Don’t use it.
- “Introducing Total Daily VORP: A Value System For Daily Lineups” is my first attempt to fix the issue. The first two sections go into greater detail about where FanGraphs and Razzball can fall short.
With the 2020 season in the books, I wanted to use TDV to take a look at this year’s top performers. Thanks to a condensed schedule that made replacing players easier than ever, it makes more sense than ever.
A quick recap: what needed fixing?
If you’re not interested in reading a few thousand words, the gist is pretty simple. FanGraphs’ calculator turns season-long outputs into auction dollars. It takes just a few steps to do that:
- Draft enough players to fill out all of the starting spots in the league.
- Average their outputs (HR, RBI, SB, etc) to find the breakeven or $0 output.
- Use the z-score (inverse standard deviation) for each category as the value gained for adding one extra HR, RBI, SB, etc.
- Total each player’s earned values from each category. Tally the value of the worst starter at every position.
- Add on extra money to each player so that the last drafted player at each position is worth $1.
There are a few extra layers, but that’s the heart of it. Razzball does things slightly differently — it uses previous seasons’ standings to convert a marginal home run into how many points that would net your team — but the mechanics are pretty much the same. They also feature a $/G metric, but they don’t quite put it to use.
The issue with this, though, is that they ignore how many games it took a player to earn their stats. And the end result is that it assumes that a player who only plays 120 games is in your lineup for all 162. FanGraphs and Razzball model a league where players can’t pick up waiver additions or change their lineups. And that’s not quite right.
For the most part, this isn’t actually an issue. They treat players who play comparable numbers of games equally. But compare two players who play different numbers of games and you don’t end up with a reasonable result. By not accounting for playing time, it becomes the most important variable. Their results also don’t scale — you can’t just multiply Aaron Judge’s 160-game auction value by 0.75 to get his 120-game projected value. That’s an issue.
Before I leave the impression that these tools are broken, though, I should say that their creators know these issues exist, acknowledge them, and urge people not to make obviously wrong conclusions. In a 2016 end-of-season post about the FanGraphs Calculator, Brad Johnson wrote:
“…the calculator does have one notable weakness when grading past production. Partial seasons can cause some confusion. Gary Sanchez makes for an easy example. In a 12-team, two-catcher league, he produced $8.60 of value according to the calculator. However, that’s assuming you only used Sanchez. In reality, you probably got a few dollars of production from a Cameron Rupp or Derek Norris.”
I should also note that Fangraphs does have a feature that tries to solve this problem. If you check the “experimental” button, it adds at-bats from replacement-level players to top batter up to 600 PA and then calculates categorical earned values from there. David Appelman described the feature as in “beta” when the calculator launched in 2015 – I think it’s a decent step forward, but it still ignores that players end up with different numbers of plate appearances for a reason. It’s important to keep those distinctions intact. In my experience with that tool, I found that players who were batting high in the order or on good teams got less of a boost.
All this criticism isn’t to say that these tools produced results that are irreparably flawed or that should be ignored. Far from that: they push us to engage with the fantasy using the same skills and mindsets that smart baseball analysts use. We’re (mostly) beyond using raw RBI totals to decide who the best hitters in the game are. Those might still be fantasy categories, but that doesn’t mean that we can’t think about fantasy statistics in a smarter way.
What does TDV do differently?
This project began with the belief that, in roto, the scarce resource in baseball is games started. You won’t place 20 plate appearances into your lineup, and you also probably won’t place an entire season into your lineup either: you start players for the games they play. So, we should be measuring a player’s worth when they play and then totaling those contributions. Here’s a quick rundown of how TDV does that:
- Pulls data from players’ starts. I use Baseball Reference’s Stathead service for this.
- Drafts players, including those who would be on the bench. They’ll play too!
- Finds the average daily outputs for each category.
- Use z-scores to find per-game categorical value, then sums those to find total daily value.
- Multiplies each player’s daily value by their games played, adds in replacement-level value for most of their games missed, and adds in the value of a “blank” game for the rest.
- Adds positional adjustments as usual.
I build in a few assumptions and choices to keep things relatively smooth. For Yahoo’s setup, I assign three bench hitters and two bench pitchers, and I then use those assumptions to fuel a rough estimate of what percentage of “days off” can be replaced. I found that bench bats were more than enough to replace an average number of days off in the short 2020 season; for most seasons, the number ends up being about 90%.
Additionally, I only use data from games that players start. Players who frequently pinch-hit, such as Shohei Ohtani and Joc Pederson, end up with warped and inaccurate per-game values if I don’t. A shot at 1 PA from Pederson is almost never a better bet than 4-5 PAs from Chris Taylor anyway, so this ends up increasing their value somewhat. I also only draft players with at least a half-season of games played. This helps reduce the chances of ending up with results that wouldn’t make sense unless you know how well players will perform before they do it (if that’s you, by the way, you shouldn’t need to use this tool). It also keeps things a little cleaner.
I plan on making some changes in the near future — I’d like to move the project to Java so that I can more smoothly switch between different years, league settings, and assumptions about replacement players. For now, though, I’m running the project through R, though it’s written in a pretty roundabout way that probably needs to be revised. But those quality-of-life updates aren’t pressing: it’s more than functional right now.
From those outputs, I’ve also been able to squeeze out an earned value calculator for Yahoo 12-team leagues! Even for leagues without daily lineups, it should be helpful for finding the value of a player who is likely to miss time because of an injury.
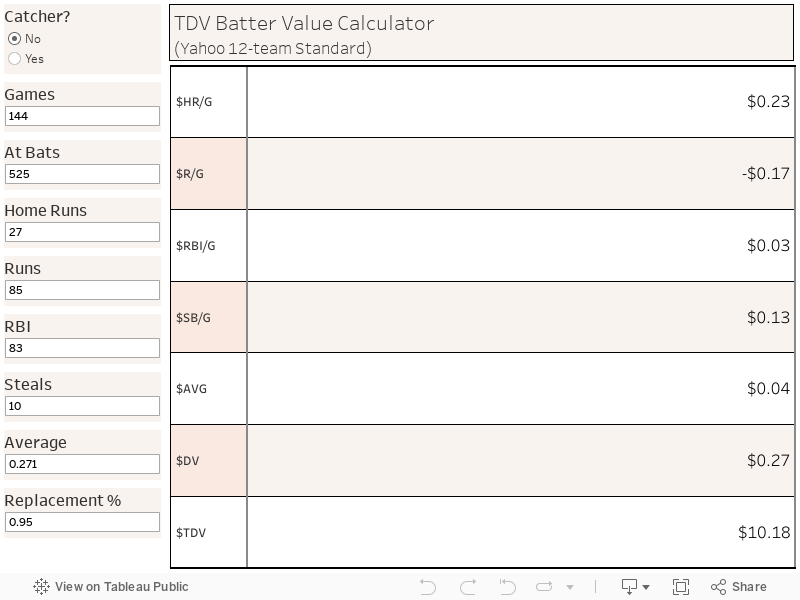
A few notes on what the numbers tell you:
- The category stats and $DV are benchmarked so that $0 is average among the batters that are drafted. Being average is pretty good! I made this choice on purpose — we’re competing against our opponents, not the waiver wire.
- $TDV is positionally adjusted so that the last starter earns at least $1. I consistently find that there do not need to be separate positional adjustments other than for catcher.
- Most batters who finished with $0/G ended up earning $10 or so, which makes sense — teams are given $10 per batter in Yahoo’s standard settings. Bench bats were well below average, producing an average of -$10 per game.
- A “zero” — no counting stats and no at-bats — is worth an average of -$65 per game. Fill your lineups! On average, even the worst player in the MLB outperforms an empty lineup spot.
- I’m not entirely satisfied with how I’ve determined Replacement%, so I’ve included it as a slider. That said, most time missed is very predictable. I’d set it in the mid-90s on average, at 100% for IL trips, and in the 80s for platoons. You’re not lazy, are you?
Different league settings can lead to different results. I plan on building a few of these for common league setups soon.
Looking Back: 2020 in Review
Before I overwhelm you with data, I want to start by comparing TDV’s results to standard FanGraphs results for Yahoo 12-team standard. FanGraphs and I end up with about the same “split” between hitters and pitchers — 55% of draft dollars are going toward batters in a Yahoo format league with 1 C, 3 OF, 2 UT, and no MI or CI.
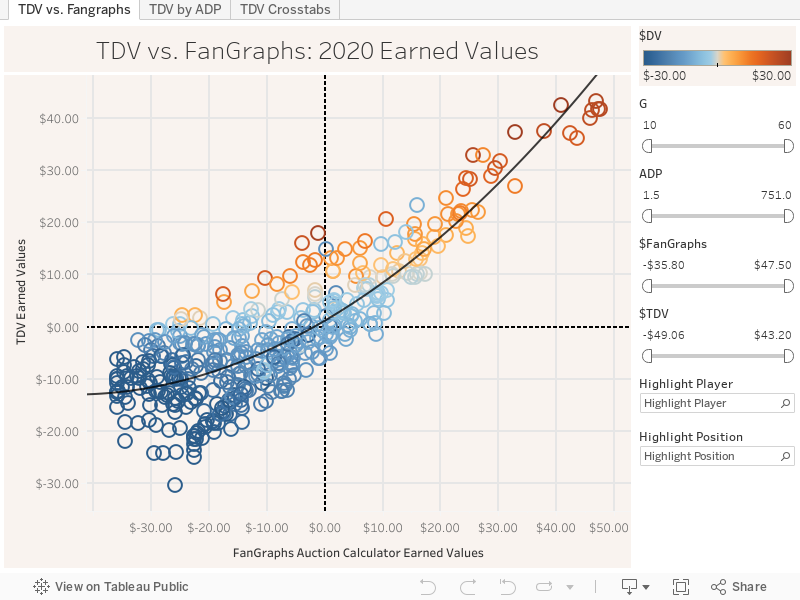
The MVP Candidates
I want to start with the cluster of players at the top right. A slew of players remained injury-free all year and put up both huge per-game and season-long numbers. So why is TDV slightly lower than FanGraphs in terms of how valuable José Ramírez was? It’s pretty simple. There’s still an equal amount of money to go around, and TDV gives more money to players who didn’t put up a full season. That has to come from somewhere.
On and above the fit line, though, are the players that this benefits most. Between a positive COVID test and a “sore left elbow,” Juan Soto missed 13 games. That’s more than 20 percent of the season! But because he missed them all in two consecutive chunks, he should have been replaceable in your lineups by a bench bat for most days. As a result, he rises in TDV’s ranks.
I’ll run out of breath repeating this to people drawing the wrong conclusions: playing games is good. Both Soto and Mookie Betts (the 2020 leader in value per game) would have been worth more if they had played all 60 games. TDV just penalizes for not playing less than traditional value methods do.
The one exception is for catchers. I don’t replace days that catchers miss, because there’s no good reason to roster a second catcher. Obviously, time missed to IL trips is different. That means catchers who play more than about 60% of their team’s games become extra valuable. Compared to the waiver wire’s options, J.T. Realmuto was so much better that he put up a $32 season. Punt catcher if you want, but the top end is more than capable of putting up huge numbers.
Finally, I want to address why Adalberto Mondesi, Trevor Story, and Whit Merrifield dip so much in TDV’s ranks while Trea Turner doesn’t. Long story short: Turner was an active contributor compared to league average in all five categories. Story negative in RBI, Merrifield in both RBI and HR, and Mondesi in everything but steals. The bar to be a five-category contributor is pretty high.
Beware the Accumulators!
I define an accumulator as a player who bats every day, never hits the IL, and has a $DV between -$15 and -$5. These guys end up with great counting stats without actually being big contributors. With nowhere to improve in terms of games played, any dip in games played makes them nearly indistinguishable from a waiver option. That makes them interesting targets to avoid in future drafts. For this year, I’m setting a minimum number of games played of 55.

Instead of looking at the busts on this list, I want to talk about those who met expectations — specifically, Paul Goldschmidt. Between a weak cast of teammates and a very pitcher-friendly park, the Cardinals were 24th in runs scored per game. He posted a career-best strikeout rate and near-best OBP, but didn’t perform all that well in fantasy this year: FanGraphs gave him $3.70 in earned value, while TDV rated him at -$2.28, making him a bench bat at best. Despite this, he was drafted 79th on average in the #2EarlyMocks.
There’s some comfort in drafting someone like Goldschmidt. He stays healthy, boosts the one rate stat that most leagues use, and has a past track record of success. But it’s important to think of every category like it’s a rate stat when drafting: on a per game basis, he was a negative in four of them. Compared to the alternatives, Goldschmidt didn’t have a safe floor — it just gave way slowly rather than all at once.
Maikel Franco should be the posterboy for this category, in truth. While FanGraphs gave him $8.90 in earned value, TDV credited him for -$1.44. I doubt many people are going to rank him too highly, but I would encourage anyone too impressed by his rebound to look just a little closer.
Some players who just missed the cutoff in Franco’s tier similarly have huge gaps in earned value. Starling Marte stayed healthy all year but showed off almost no power while playing for a pair of mediocre offenses. He was a huge drain on HR and RBI, and finished the year with a -1.15 $DV. Fangraphs had him at about $15 in earned value, but TDV had him near $10. Cavan Biggio fits the same bill, but he also managed to be a large drain on batting average.
It’s definitely possible that several of these players improve next year. Goldschmidt could actually score when he reaches base, or his teammates could getting out. But given what Busch Stadium does to barrels (ask Marcell Ozuna, if you’re curious), he’s nowhere near risk-free. This isn’t a “don’t draft” list — it’s just a warning about a type of player that will be overvalued next year.
Part-Time Powerhouses
If accumulators need to stay healthy and improve, these players need to hope their skills translate to a full-season. For this group, I’m setting the bar at a $DV of $0 and fewer than 45 games played.

Some names on this list need to get healthy. Aaron Judge is the obvious name, but I want to point out just how good he was when he played. His average auction value for NFBC leagues was $23, and considering that was for 15-team, Judge almost certainly returned a profit in just 26 starts. Ozzie Albies is in a similar position, but his historical record marks him as a super-accumulator: over 160 games in 2019, he returned $11.80 with a $DV of -$2. The difference? Albies’ 32 HR pace in 2020 was much greater than 24 he hit in both 2018 and 2019.
Albies wasn’t the only player who saw a jump in per-game productivity. Anthony Santander was among the AL’s RBI leaders before his injury, and Eric Hosmer outpaces him in that category. Both saw large jumps in their line drive rates, though, which casts some doubt on whether they should be trusted in 2021. While line drives come with huge xWOBACON numbers, it’s notoriously not “sticky.” Even so, those who rostered them in 2020 definitely reaped benefits when they played.
Even harder to get a read on that players like Hosmer are rookies who mashed in short stints. Jared Walsh captains that squad: his $DV of $28.44 was third in the league behind only Betts and Soto. Walsh hit nine home runs in just 24 games, but I’m willing to bet half of those were while he was on your waiver wire. He shouldn’t keep up a 70 home run pace, but he’s certainly an interesting option going forward. Randy Arozarena and Ke’Bryan Hayes also notched solid $TDV numbers despite negative FanGraphs dollars. Hayes’s ADP will be one to watch — power wasn’t part of his scouting profile, but he did well enough to be a contributor there. His batting average probably comes down from .376, though.
Finally, there’s a glut of top-tier catchers in this group. If the DH sticks in the National League, several of them should benefit. Will Smith sneakily posted a $DV good enough for him to start in util spots, as did James McCann. I don’t recommend rostering two catchers if you’re not forced to. But if they see larger PA shares next year — McCann probably outside of Chicago — they should be draft-day targets.
How good was ADP?
Not great, Bob!

This graph shows which players returned more season-long value than keeping a bench-level player in the same lineup spot. I like this look because it lets us see which players deserved to be dropped in 12-team. For example, Cody Bellinger probably disappointed those who drafted him, he was still worth rostering all year — his -$0.90 $DV was slightly below average among players who deserved to start in Yahoo 12-team standard.
And as you can see, ADP wasn’t all the predictive of how productive they were. I’ve excluded all players with fewer than 10 games started to cut down on the noise, but even so, this graph is loud. The logarithmic line of best fit had the best r^2 of correlation at 0.20, which is fairly poor.
Others drafted toward the top were far more disappointing than Bellinger. And it’s interesting to see how many of those flops came not from injury but from, well, not being good. Of the 69 hitters drafted within ADP top 100, only six missed more than half the season: Bo Bichette, Ozzie Albies, Giancarlo Stanton, Josh Donaldson, Aaron Judge, and Yordan Alvarez. But Bichette, Albies, and Judge still managed to put up more than $10 of total value in their short time. On the other hand, 26 hitters drafted within the top 100 played at least half the season and still posted a $TDV below replacement level compared to 28 who finished above $10.
This subject deserves more extensive discussion than I’ll provide here. My short takeaways? It’s fun to realize just how wrong we collectively were this season. Very few busts were because of injuries. But that does mean that many of them were because we just didn’t predict well.
If you want to trawl through all the data, I compiled data from every player who played at least 10 games below.

Where should we go from here?
If we’re boiling this down to just a few simple conclusions, it’s these:
- Playing often doesn’t mean playing well.
- It’s possible to put up big value in a short window.
- Plenty of early picks are going to bust.
There’s nothing truly groundbreaking about these ideas. But it’s important that we start acting on them in the same way we think about the rest of baseball. It’s no coincidence that almost all of the stats that smart baseball writers cite — barrel%, K-BB%, CSW% — are rate stats. Ratios make fair comparisons much easier.
It’s funny to me, then, that many of the smartest baseball minds are also terrible fantasy players. That someone who can explain exactly why Chris Paddack’s fastball stopped working can also lose their mind and draft Victor Robles within the top 100 just blows my mind.
This project is for them. It’s for people who refuse to give a player a projection because they know the range of outcomes is just too large. People who want to see how good someone would have been if they’d hit their expected number of home runs instead of getting robbed by Globe Life Field. They’re the ones with the patience to play roto, anyway.
I want them to be able to more easily use their knowledge to be successful in fake baseball. I’m hoping this can become an easy-to-use set of tools that helps people get more out of what they know. I think the earned value calculator will be the most useful, but I’m opened minded. If there are features or applications you’d like to see, be sure to reach out to me on Twitter.
Pitchers are coming soon. Get ready for value over Nick’s streaming picks.
Photo by Randy Litzinger/Icon Sportswire | Adapted by Rick Orengo (@OneFiddyOne on Twitter)
