


When it comes to baseball, there is no shortage of information available for analysis. Not every piece of information is relevant to fantasy baseball, though. However, one piece of data that you absolutely should be incorporating into your fantasy baseball analysis for pitchers is Out%. Out Rate is a stat that we (Kyle Bland, Brett Hammit, and I) developed here at PitcherList. Each year, we learn more and more about it, and as promised in December, we have some pretty interesting updates for you regarding Out%.
We have been able to break down outs into “Good Outs” and “Lucky Outs,” adding another layer to analyze not just pitcher performance, but pitch performance too.
First, though, here is a basic recap of what Out% measures.
Essentially, it’s a stat that measures how often a pitcher’s pitch induces an out of any kind. Each pitch type has an Out% that we can measure against the league average. These were the league average Out Rates at the end of last season for each pitch type:
- Splitter (FS) = 20.9% (down .8% from the end of the 2024 season)
- Changeup (CH) = 19.5% (up .1% from 2024)
- Sweeper (ST) = 18% (down .7% from 2024)
- Slider (SL) = 18.5% (up .2% from 2024)
- Sinker (SI) = 17.9% (up .1% from 2024)
- Curveball (CU) = 17% (up .2% from 2024)
- Cutter (FC) = 16.1% (down .2% from 2024)
- Fastball (FF) = 16.5% (same as 2024)
Generally, these Out Rates do not fluctuate too much year to year. In fact, here is the year-to-year breakdown of Out%, calculating the data from 2023-2024 vs 2024-2025:
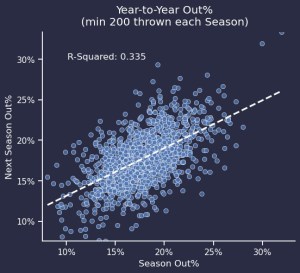
The closer the R-Squared is to 1.0, the stickier the stat, which makes Out% relatively sticky year to year. That means we can reasonably assume a pitcher will perform similarly in Out% year-to-year as long as they maintain pitch quality.
Take Sonny Gray, for example, whose sweeper has been the best pitch in baseball at inducing outs for two years in a row. Last season, his sweeper’s Out Rate was 33%, meaning a third of the time that he threw it, it resulted in an out. It was also 15% more effective than league average at getting outs. This is a pitch we can expect, to a certain extent, to perform similarly this season as well. It’s also especially validating when the Out% lines up with PLV, which measures pitch quality, so that we know it is a legitimately great pitch:
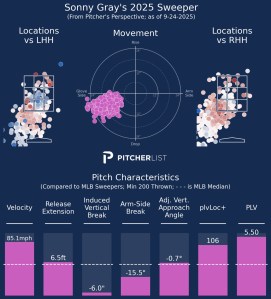
Gray’s sweeper has a 5.50 PLV, which makes it a quality pitch. He throws it with elite velocity and location, as well as a ton of break. Factoring in the quality, it is clear why it induces outs at such a high rate. In 2024, it had a 5.39 PLV, with the biggest difference being a slightly worse plvLoc+.
And it is no wonder Gray’s sweeper works so well when you see it in action like this:
Sonny Gray, Sick 86mph Back Foot Sweeper…and Sword. ⚔️ pic.twitter.com/JULgElUGBY
— Rob Friedman (@PitchingNinja) August 5, 2025
For more in-depth details relating to the basics of Out%, check out this article from 2024, and for some info on what we learned from the 2025 season regarding Out%, check out this article from December 2025.
Now, onto some cool new developments with Out% for 2026: Good vs. Lucky Outs.
What is a Good Out?
Good Outs are balls that have an expected batting average below .250, meaning that they should be outs about 75% of the time. This also includes strikeouts, since technically their xBA is zero.
Basically, Good Outs are outs that were supposed to turn into outs for pitchers. It is a way for us to filter out the fluky defensive plays, where an outfielder nabs a ball at the warning track like this:
Denzel Clarke with his first home run robbery of 2026 WOW 🔥 pic.twitter.com/Im3HSUgkj6
— js9innings (@js9inningsmedia) April 1, 2026
Or makes a crazy throw from down the line like this:
I am legally obligated to post every single Manny Machado web gem I come across. pic.twitter.com/eK9oghGGZz
— Zach Bollinger (@zachbollinger18) March 7, 2026
Good Outs are outs that are “earned” by the pitcher. Think about it – strikeouts usually come from good location, good stuff, and/or good movement, things that are in a pitcher’s control. The same can be said for inducing weak grounders, like Cristopher Sánchez, who wrapped up 2025 with a 58% GB rate and a 5% barrel rate. Pitching like that should earn a pitcher a high Good Out% on their pitches that result in these sorts of outs.
Interestingly, Good Outs are even stickier than plain old Out%. Take a look here:

Again, this data is measuring 2023-2024 against 2024-2025. It shows that pitchers like Sanchez should be able to repeat their Good Out% year-to-year. Sanchez’s sinker and changeup both had 61% GB rates last season. His sinker had a 5% barrel/PA rate last year, and his changeup’s was .9%. They also had a combined three-degree launch angle. Because of his superb pitch quality, location, and sequencing, he could induce outs in other ways than just strikeouts. His ability to earn outs is something that we can expect him to maintain over time until something changes in his pitch quality.
And we are already seeing this play out in 2026 for Sanchez, albeit in a very small sample. His changeup has a 20% Out Rate, which is league average at the moment. But it has an 18% Good Out rate, meaning it is truly earning him those outs. It also means he should throw this pitch heavily to righty batters, not just in two-strike counts, but consistently throughout at-bats. Continuing to do so should result in continued success.
What is a Lucky Out?
Remember those Manny Machado and Denzel Clarke plays you just saw? Those are lucky outs, or balls that have an expected batting average of .250 or above, that end up turning into outs.
These could be hard-hit balls, line drives, or other hard-to-get-to batted balls that elite defensemen get to, when others may not have. Either way, these are pitches that are expected to go for hits about 75% of the time, that somehow turn into outs.
Lucky outs carry a little bit more “noise,” meaning you have to dig more into the individual pitcher and some other data points to truly find out why their outs are lucky – defense, BABIP, GB%, exit velocity, barrel%, and HardHit% would be great places to look to see what is happening after the pitch is thrown to figure out how and why the pitcher is inducing outs. You can see below how lucky outs are less sticky:
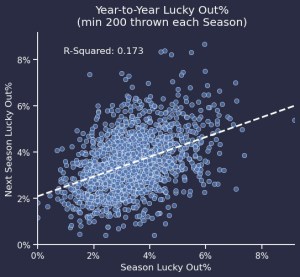
Because of outside factors, especially defensive plays, lucky outs are less likely to be repeatable from year to year. Where Good Outs weed out the fluky plays, but lucky outs include them. This is why good outs feel earned and lucky outs feel…well…lucky.
Additionally, pitchers that are relying heavily on lucky outs are not earning their outs, meaning their success is not earned from their abilities. Pitchers who rely on lucky outs could end up heading towards regression if things stop breaking their way.
What Do I Do With This Information?
Now that you know what Good and Lucky Outs are, let’s review how to use them.
Cristopher Sánchez’s changeup, as mentioned, has a 20% out rate, which is about league average. However, his Good Out Rate on the changeup is 18.6%, meaning just 1.4% of those outs are lucky. He is earning a significant amount of those outs with the changeup. His sinker has performed above average in Out% as well, at 21%, with a 15.6% Good Out Rate. We can reasonably assume that as long as he maintains these percentages, he should end up earning a high-quality ERA, much like last season. He is earning his outs, not relying on luck.
Lining up these pitches with PLV will also help determine whether or not their Out Rates are sustainable. If a pitcher has a high Out% on a high-quality pitch, he should be performing well in terms of ERA. Similarly, pitches with high Out Rates, but low PLV scores, could mean their performance is unsustainable, especially if the Lucky Out% is high.
Consider another pitcher off to a hot start in Trevor Rogers, who has an above-average Out% on both his fastball and changeup, with his changeup posting a 25% Out Rate. However, that Out% is propped up by an 11.6% lucky out rate. Unless he can induce more strikeouts or weak grounders with it, that likely will not be sustainable, and neither will his ERA.
When I say that Good and Lucky Out% is like a cheat code, this is what I mean. You can see which pitches result in outs the most, but not only that, you can see whether or not those pitches deserve the outs they induce. This is a way for fantasy baseball managers to decide to start a lefty pitcher with a killer slider against a heavy lefty-hitting lineup and to avoid a righty-heavy lineup if their changeup has not been inducing outs. It is also a way fantasy managers can see why pitchers are performing well or not, and to figure out candidates they should buy or sell.
What Are Some of the Best Out Pitches So Far?
It is still very early in the season, but there are six pitches that are above average in Out%, and have 100% of their Out Rate considered a Good Out. Those pitches are
- Eric Lauer’s fastball
- Freddy Peralta’s changeup
- Drew Rasmussen’s cutter
- Yusei Kikuchi’s fastball
- Paul Skenes‘ fastball
- Emerson Hancock’s fastball
Cool, Now What?
Every week, I will publish an Out% Update, where I will highlight some of the best and worst out pitches of the season. Each post will contain the league average Out Rates for each pitch, Out% leaders for each pitch, and which pitchers you should target or avoid based on Out%.
You can also see which pitches are performing well by checking out our nifty Google Sheet. To edit and filter, simply make a copy. The Out Rates highlighted in green are pitches that have a Good Out% that is at least six times higher than their Lucky Out%. Out Rates in red mean their Good Out% is under three times their Lucky Out% – pitches that are a little suspect in earning their outs. The average difference between Good and Lucky Outs is 4.5%.
