


During the offseason between the 2022 and 2023 seasons, I wrote an article analyzing which pitchers would be impacted by the shift ban, and how they would be affected. I looked into which pitchers ended up getting a bulk of their outs thanks to the shift. Then I began wondering if it was possible to simply figure out which pitchers were the best at getting outs.
Little did I know that some of my colleagues here at Pitcher List were wondering the same thing. Brett Hammit, Kyle Bland, Nick Pollack, Colin Charles, and I had all gone down a rabbit hole with some version of Out% at one time or another. Once we put our heads together and talked it through, we came up with a strikingly simple formula:
(Pitches resulting in outs) / (Total pitches)
From there, each pitch is given an average out rate based on the collective data. Here is the average out rate for each type of pitch:
- Fork ball (FO) = 21.8%
- Splitter (FS) = 21.5%
- Changeup (CH) = 19.4%
- Sweeper (ST) = 19%
- Slider (SL) = 18%
- Knuckle Curve (KC) = 17.4%
- Sinker (SI) = 17.1%
- Curveball (CU) = 17%
- Slurve (SV) = 16.7%
- Cutter (FC) = 16.7%
- Fastball (FF) = 15.7%
Overall Out% Data
Credit for the graphs goes to Brett Hammit, who put in a ton of work gathering and working with the data. He also made some great visuals to help understand out rate.
Here is how out rate looks in terms of pitch distribution.
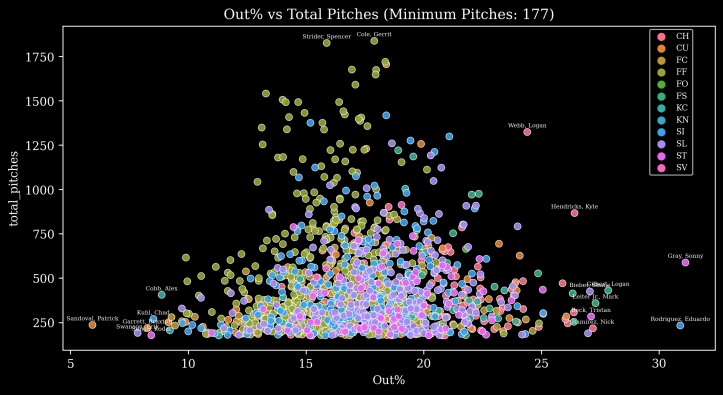
Unsurprisingly, fastballs tend to have the lowest rate of getting batters out among all pitches. The average out rate for fastballs is 15.7%, while the average out rate for fork balls is 21.8%. Fastballs typically allow harder contact than other pitches and have a higher likelihood of turning into hits. Pitchers also throw fastballs earlier in the count than most other pitches and use them to set up out pitches like offspeed and breaking balls.
This means that George Kirby, who threw 1112 fastballs, earned outs on 224 of them, and has a 20.1% out rate, has one of the best fastballs in baseball in terms of getting batters out.
Lots of relievers show up on the fastball Out% leaderboard including Joel Payamps, Caleb Thielbar, and Pete Fairbanks. Relievers have less volume of total pitches and generally have a smaller arsenal of pitches, so it is no surprise to see them atop the fastball leaderboard for out rate.
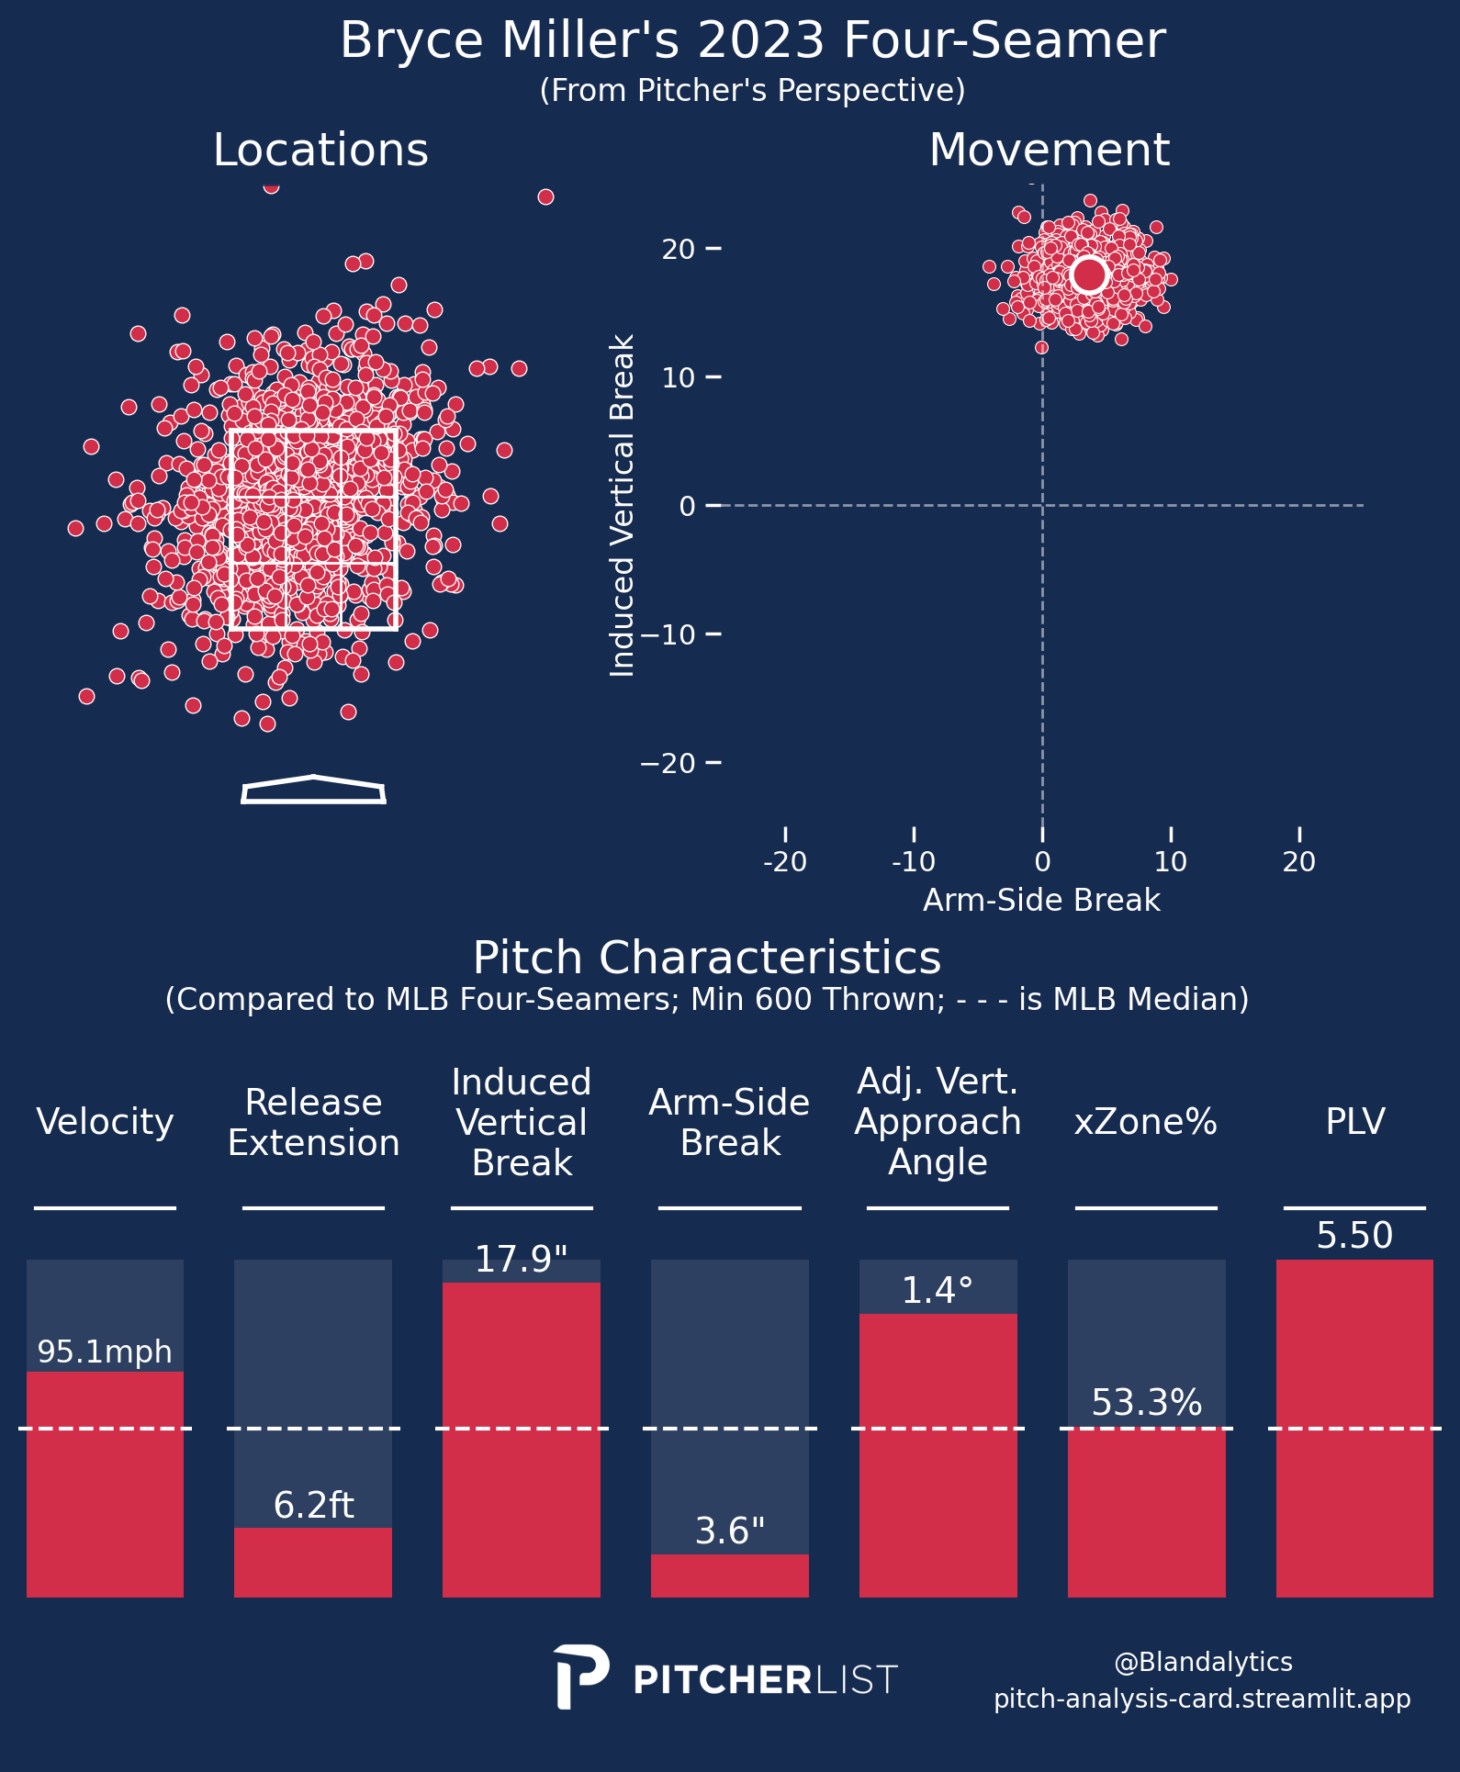
Other pitchers with fastballs that grade above league average in terms of out rate include Trevor Williams, Jordan Lyles, Cristian Javier, Kevin Gausman, Nathan Eovaldi, Gerrit Cole, Zac Gallen, Zack Wheeler, Jesús Luzardo, Bryce Miller, and Justin Steele.
When cross-referencing with PLV, Bryce Miller had the best score out of this bunch, though all but Jordan Lyles had a fastball PLV over five, which is league average.
Here is another grid to show the breakdown of out rate vs total pitches, separated into each pitch type.
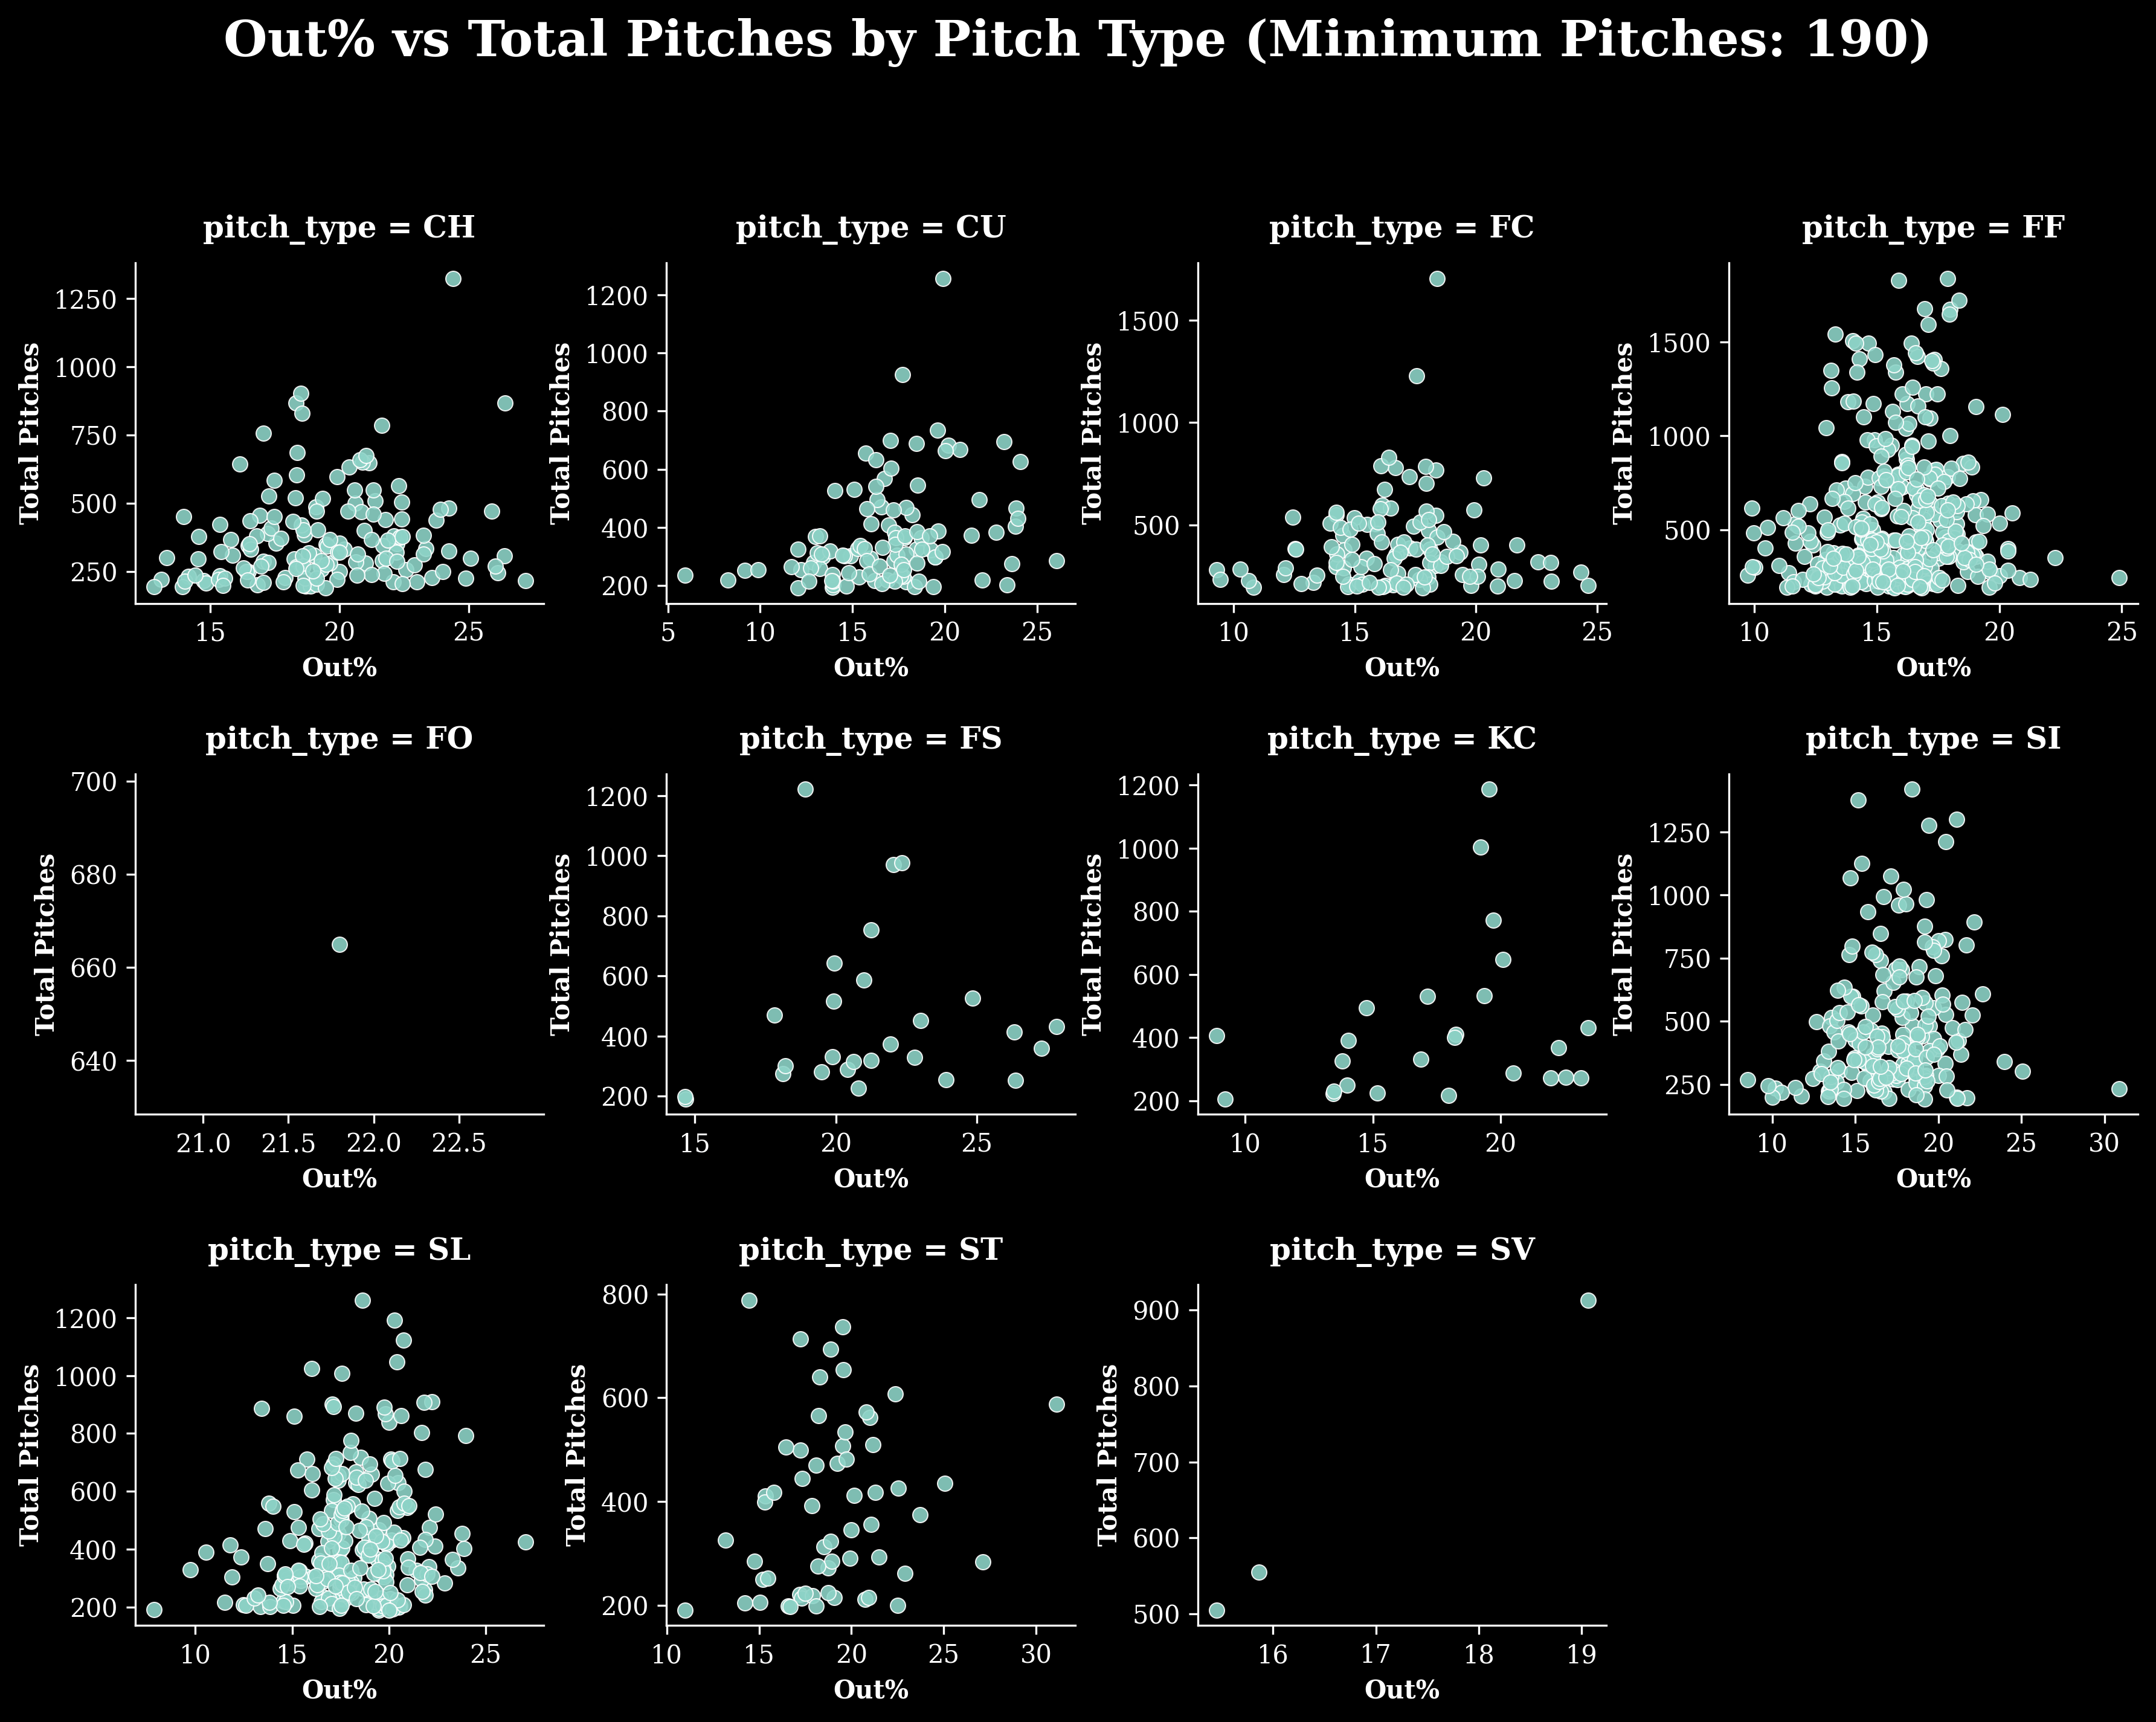
There are some outliers but what this shows is that breaking pitches, especially sliders and curveballs, tend to have higher out rates. But beyond that, the more that a pitcher throws those pitches, the higher their out rate, especially those with elite stuff.
43 pitchers threw a curveball at least 350 times last season, and 28 of them had above-average out rates. Of those 28, 14 were among the league leaders in curveballs thrown. Charlie Morton threw the most curveballs, with 1228 thrown last season. His curveball out rate was 20.1%, which was 4% better than league average. Rich Hill, Jordan Montgomery, Framber Valdez, Zach Eflin, Domingo Germán, Alex Lange, Pierce Johnson, Nick Pivetta, Yusei Kikuchi, Justin Verlander, Blake Snell, Adam Wainwright, and Aaron Civale were also exceptional at getting batters out with curveballs last season.
Among this group, Adam Wainwright had the best curveball PLV at 5.40 (Kikuchi was next best), while Verlander had the worst at 4.82. Here is Kikuchi’s curveball PLV data:
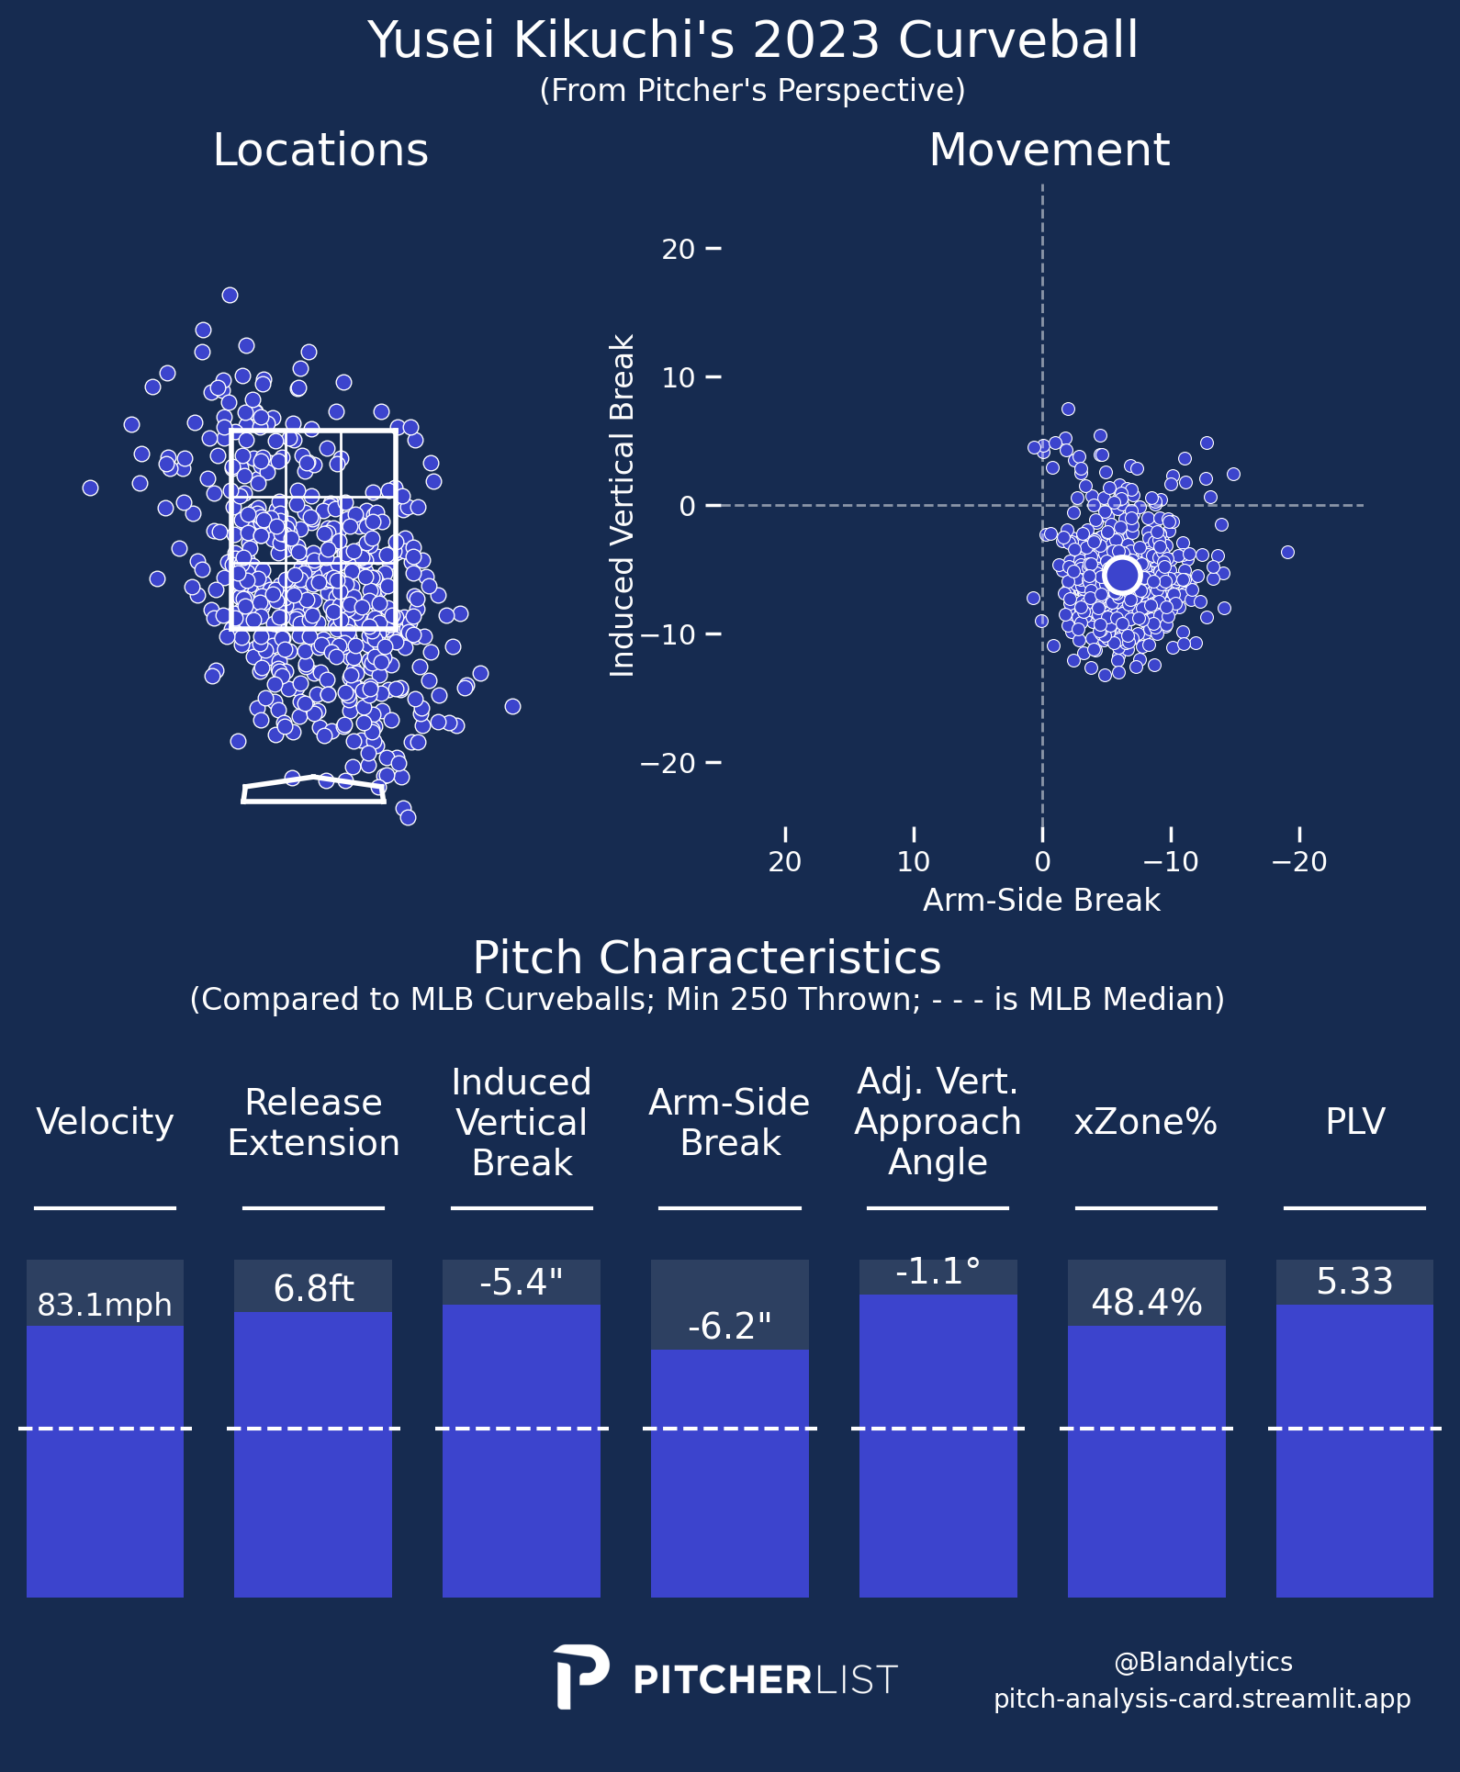
Kikuchi gets a ton of extension relative to league average. He also has excellent break on his curveball and locates his curveball well.
However, among pitchers with at least 350 curveballs thrown last season, Tyler Glasnow tops the list with a 24.29% out rate, though it measured at league average in terms of PLV.
Similarly, pitchers with great sliders who lean on them tend to have a better out rate. Among pitchers who threw sliders at least 600 times, 29 had above average Out%. Of those 29, 14 were among the league leaders in sliders thrown.
Among the leaders in sliders thrown, Jon Gray had the best Out rate at 22.2%, which is 4% above league average. Steele, Clayton Kershaw, Reid Detmers, Brady Singer, Spencer Strider, Kyle Bradish, Jakob Junis, Johan Oviedo, Logan Gilbert, Bryan Abreu, Dylan Cease, Miles Mikolas, and Graham Ashcraft also top the list.
The best PLV on a slider from this group of pitchers belongs to Bradish at 5.71. Detmers had the worst PLV of the group at 4.97. Here’s how Bradish’s PLV data looks for his slider:
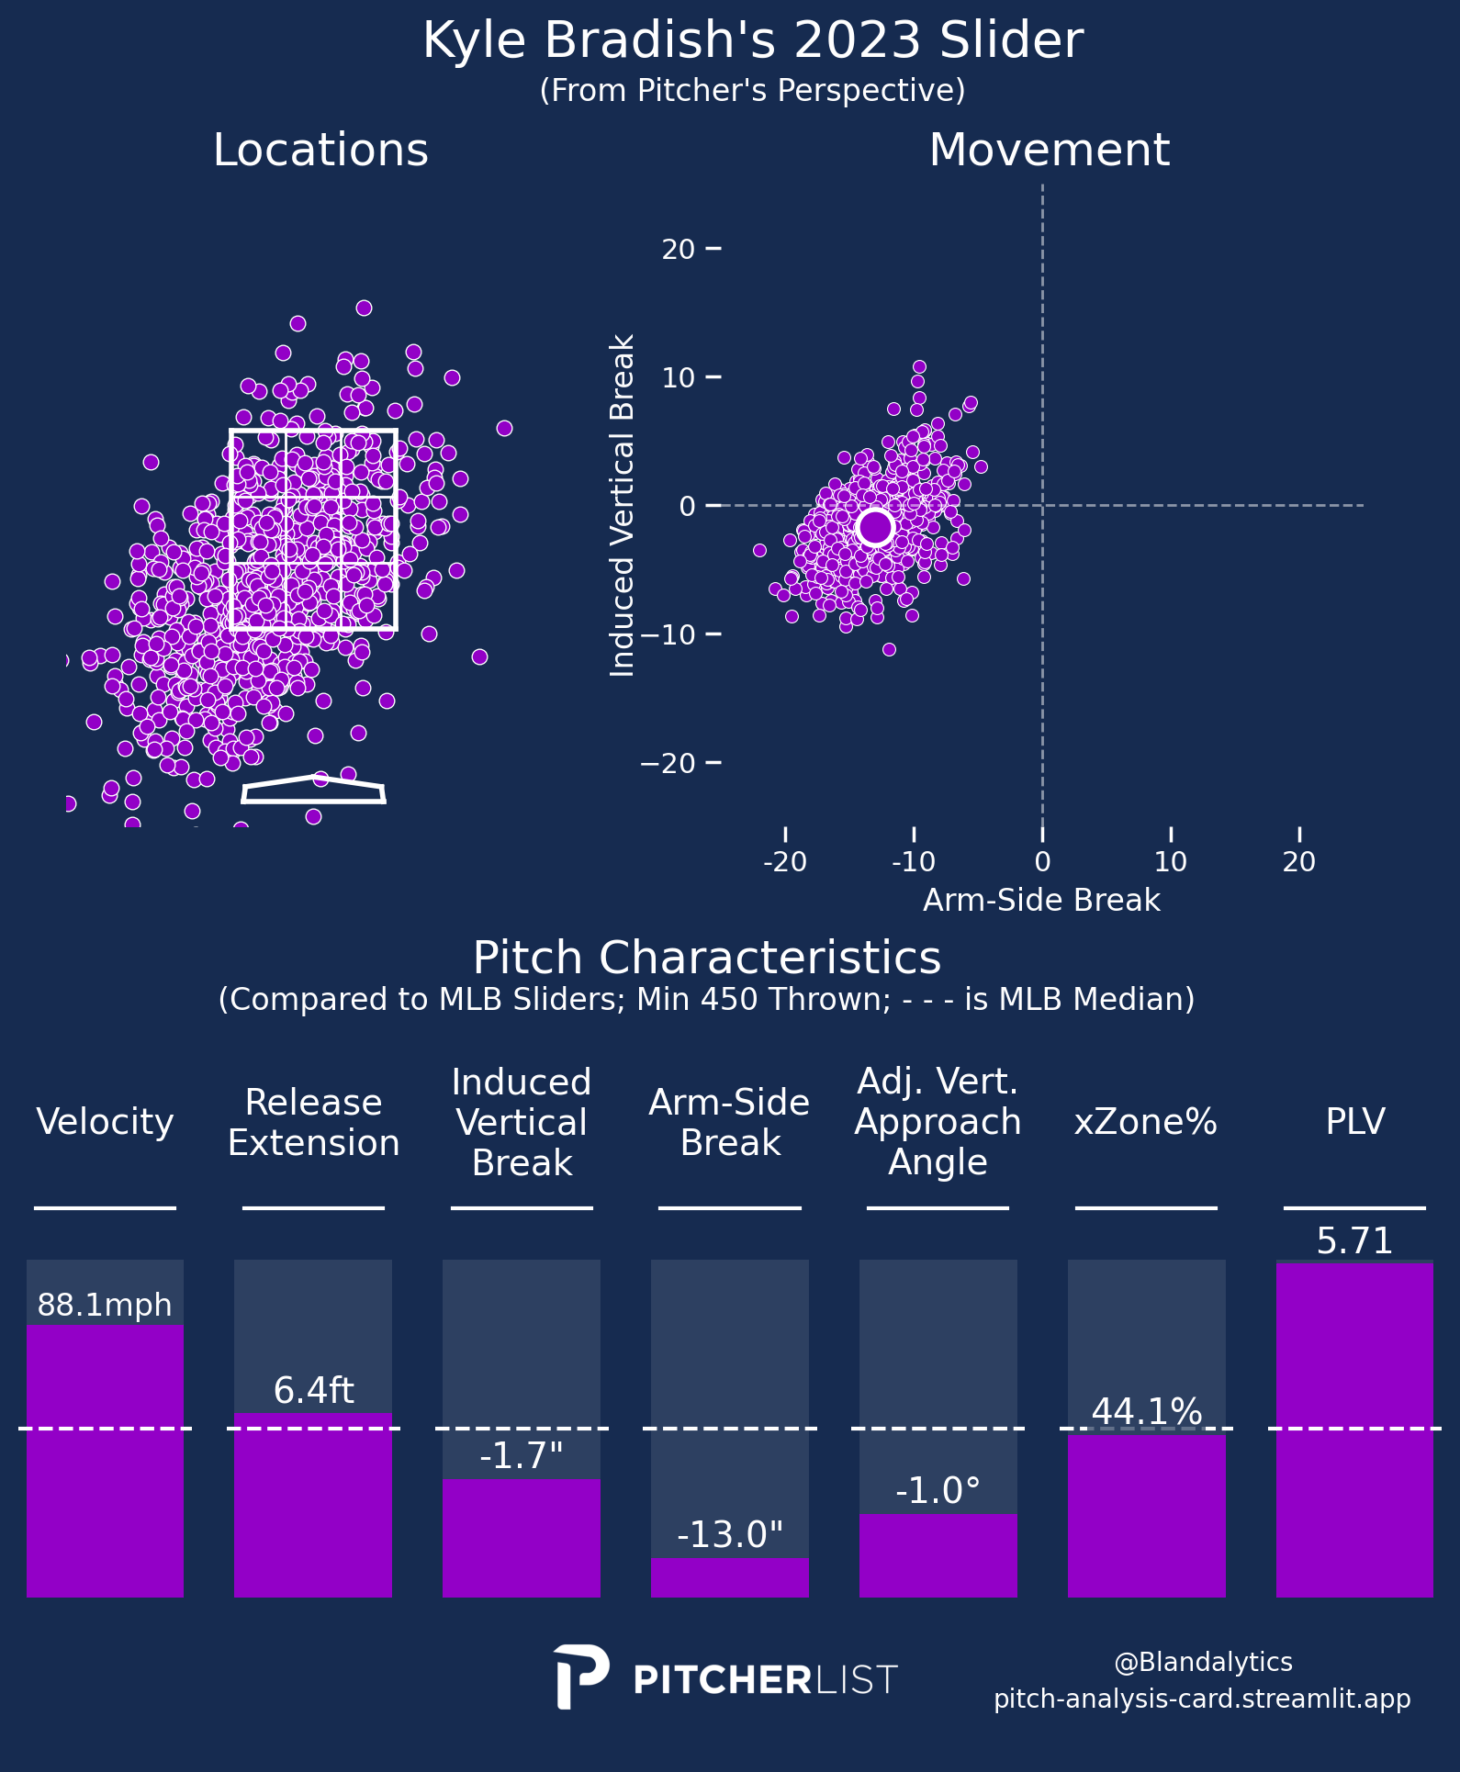
Where Bradish may lack in break on his slider, he makes up for in velocity and extension. He locates his slider well too, which makes it one of the best sliders in baseball.
Interestingly our PLV data mostly corroborates the data from out rate in terms of the quality of the pitches. Among the top-performing 57 curveballs and sliders, only four had below-average PLV data.
Out% Leaders
The following pitchers are the leaders in each pitch according to out rate, with the league average out rate in parentheses next to the pitch, and the pitchers’ out rate in parentheses next to their names. To eliminate relievers or other pitchers with small sample sizes, pitchers must have met the league average in the number of pitches thrown for each pitch.
- Fork ball (21.8%) = Kodai Senga (21.8% – he was the only one with a registered fork ball)
- Splitter (21.5%) = Logan Gilbert (27.8%)
- Changeup (19.4%) = Kyle Hendricks (26.4%)
- Sweeper (19%) = Sonny Gray (29.4%)
- Slider (18%) = Yusei Kikuchi (23.9%)
- Knuckle Curve (17.4%) = Kyle Freeland (23.6%)
- Sinker (17.1%) = George Kirby (22.5%)
- Curveball (17%) = Blake Snell (23.8%)
- Slurve (16.7%) = José Berríos (19%)
- Cutter (16.7%) = Dean Kremer (19.9%)
- Fastball (15.7%) = George Kirby (20.1%)
Unfortunately, we do not have specific PLV data on Senga’s fork ball, Freeland’s knuckle curve, or Berrios’ slurve. Kirby’s sinker and Hendricks’ changeup are both a tick below average for PLV – .01 and .02 points respectively. And Alcantara’s fastball is .1 points below league average. But we do have PLV data on the other pitchers, and it aligns with their out rate.
Here is how Gilbert’s splitter looks according to PLV:
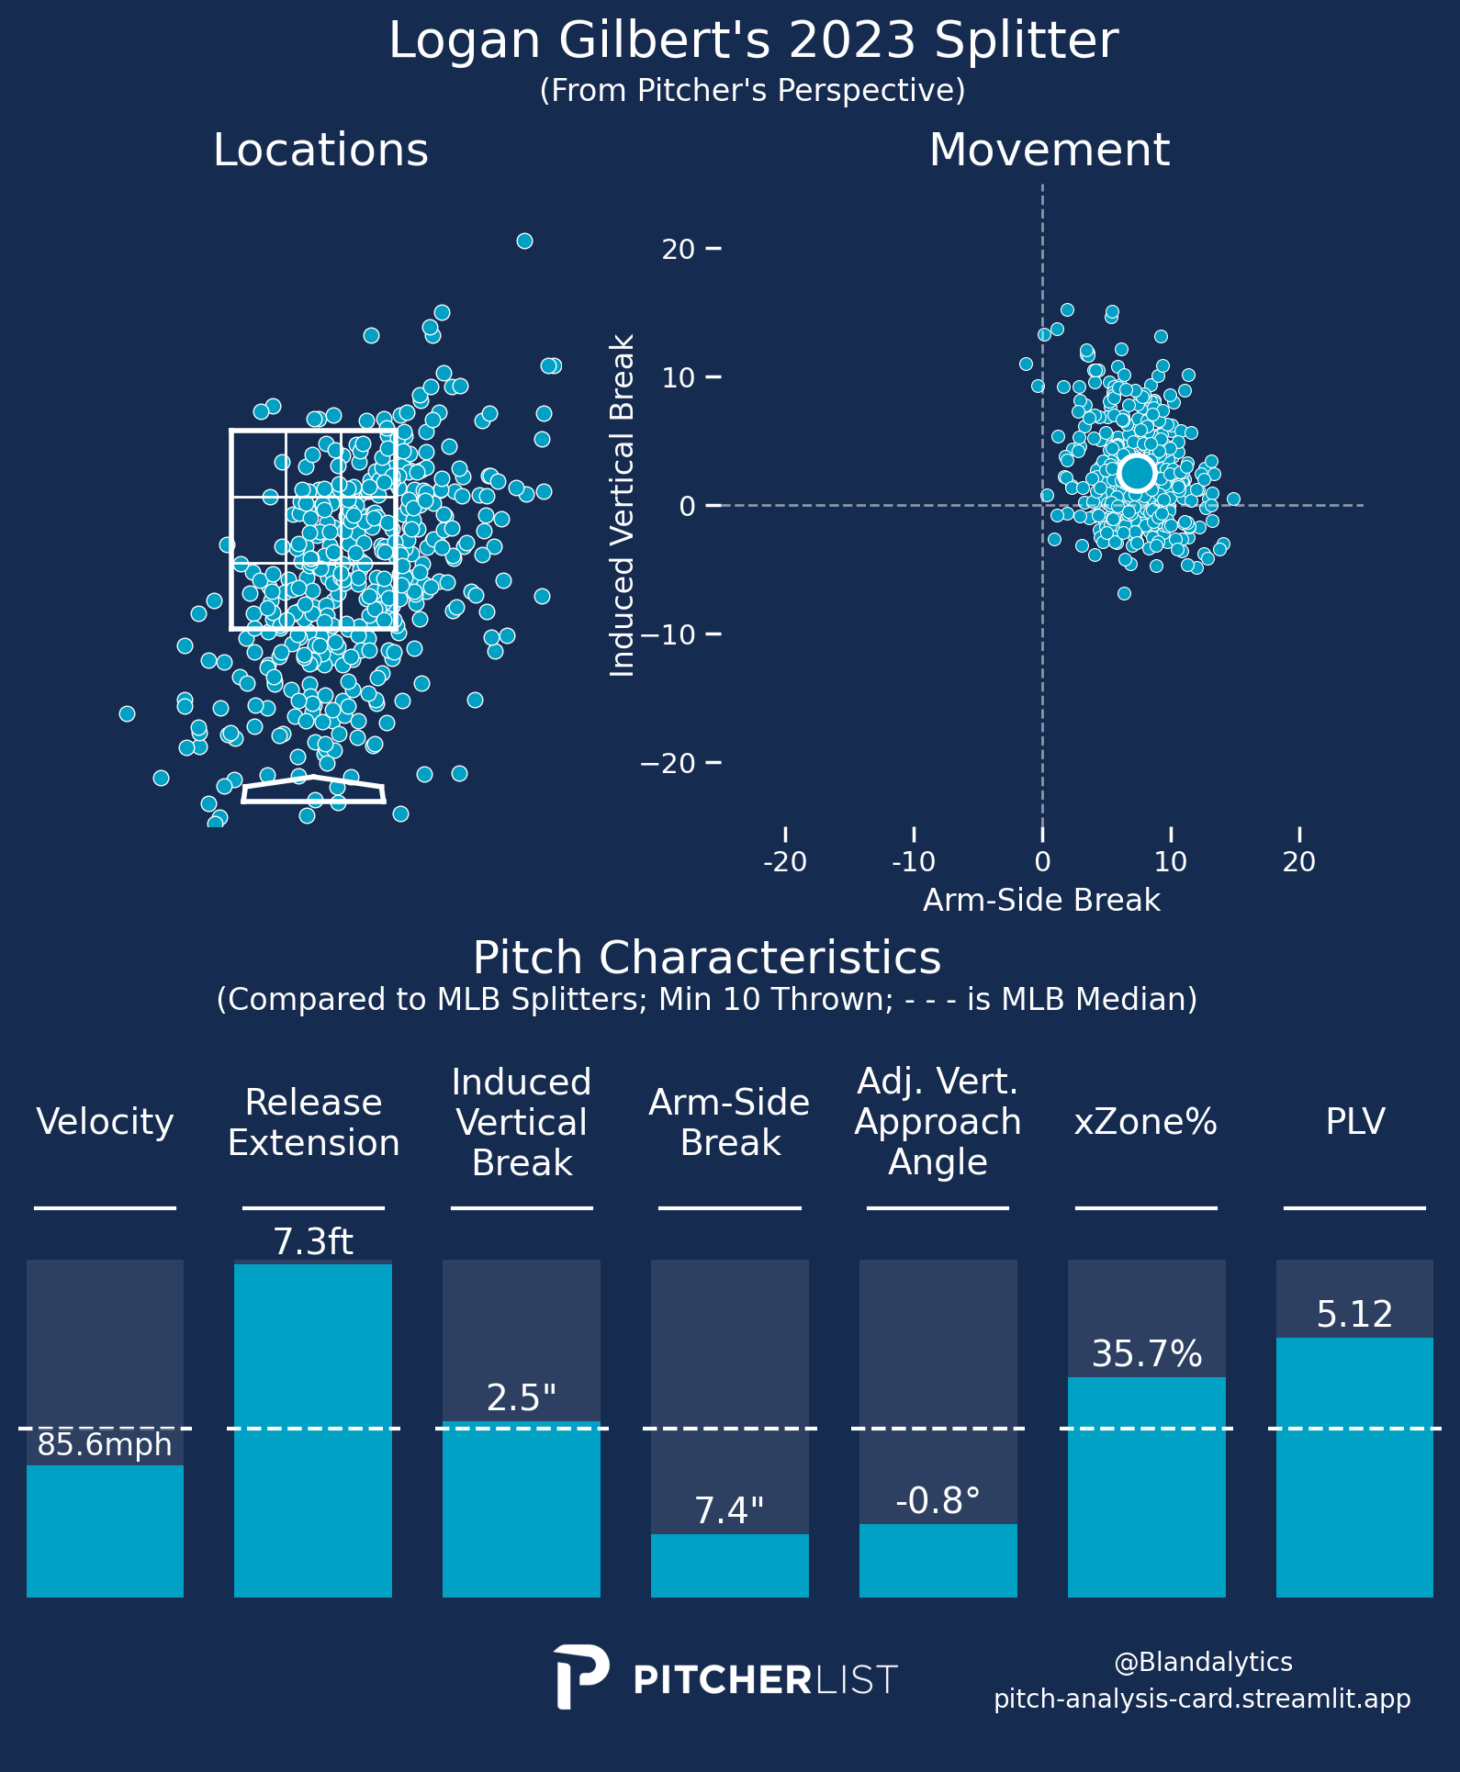
Gilbert has an absurd extension on his splitter, helping him fool batters since the velocity is slightly below average. He locates it extremely well too, which also shows in his 103 Location+, second only to Kevin Gausman.
Among pitchers who threw their splitter in at least 75 PAs last season, Gilbert had the 12th-best whiff rate at 34% and the eighth-best putaway rate at 24%. This backs up his elite out rate on this pitch.
Gilbert also possesses above-average out rates on his slider and fastball, both of which carry above-average PLV grades as well.
Take a look at Gray’s sweeper:
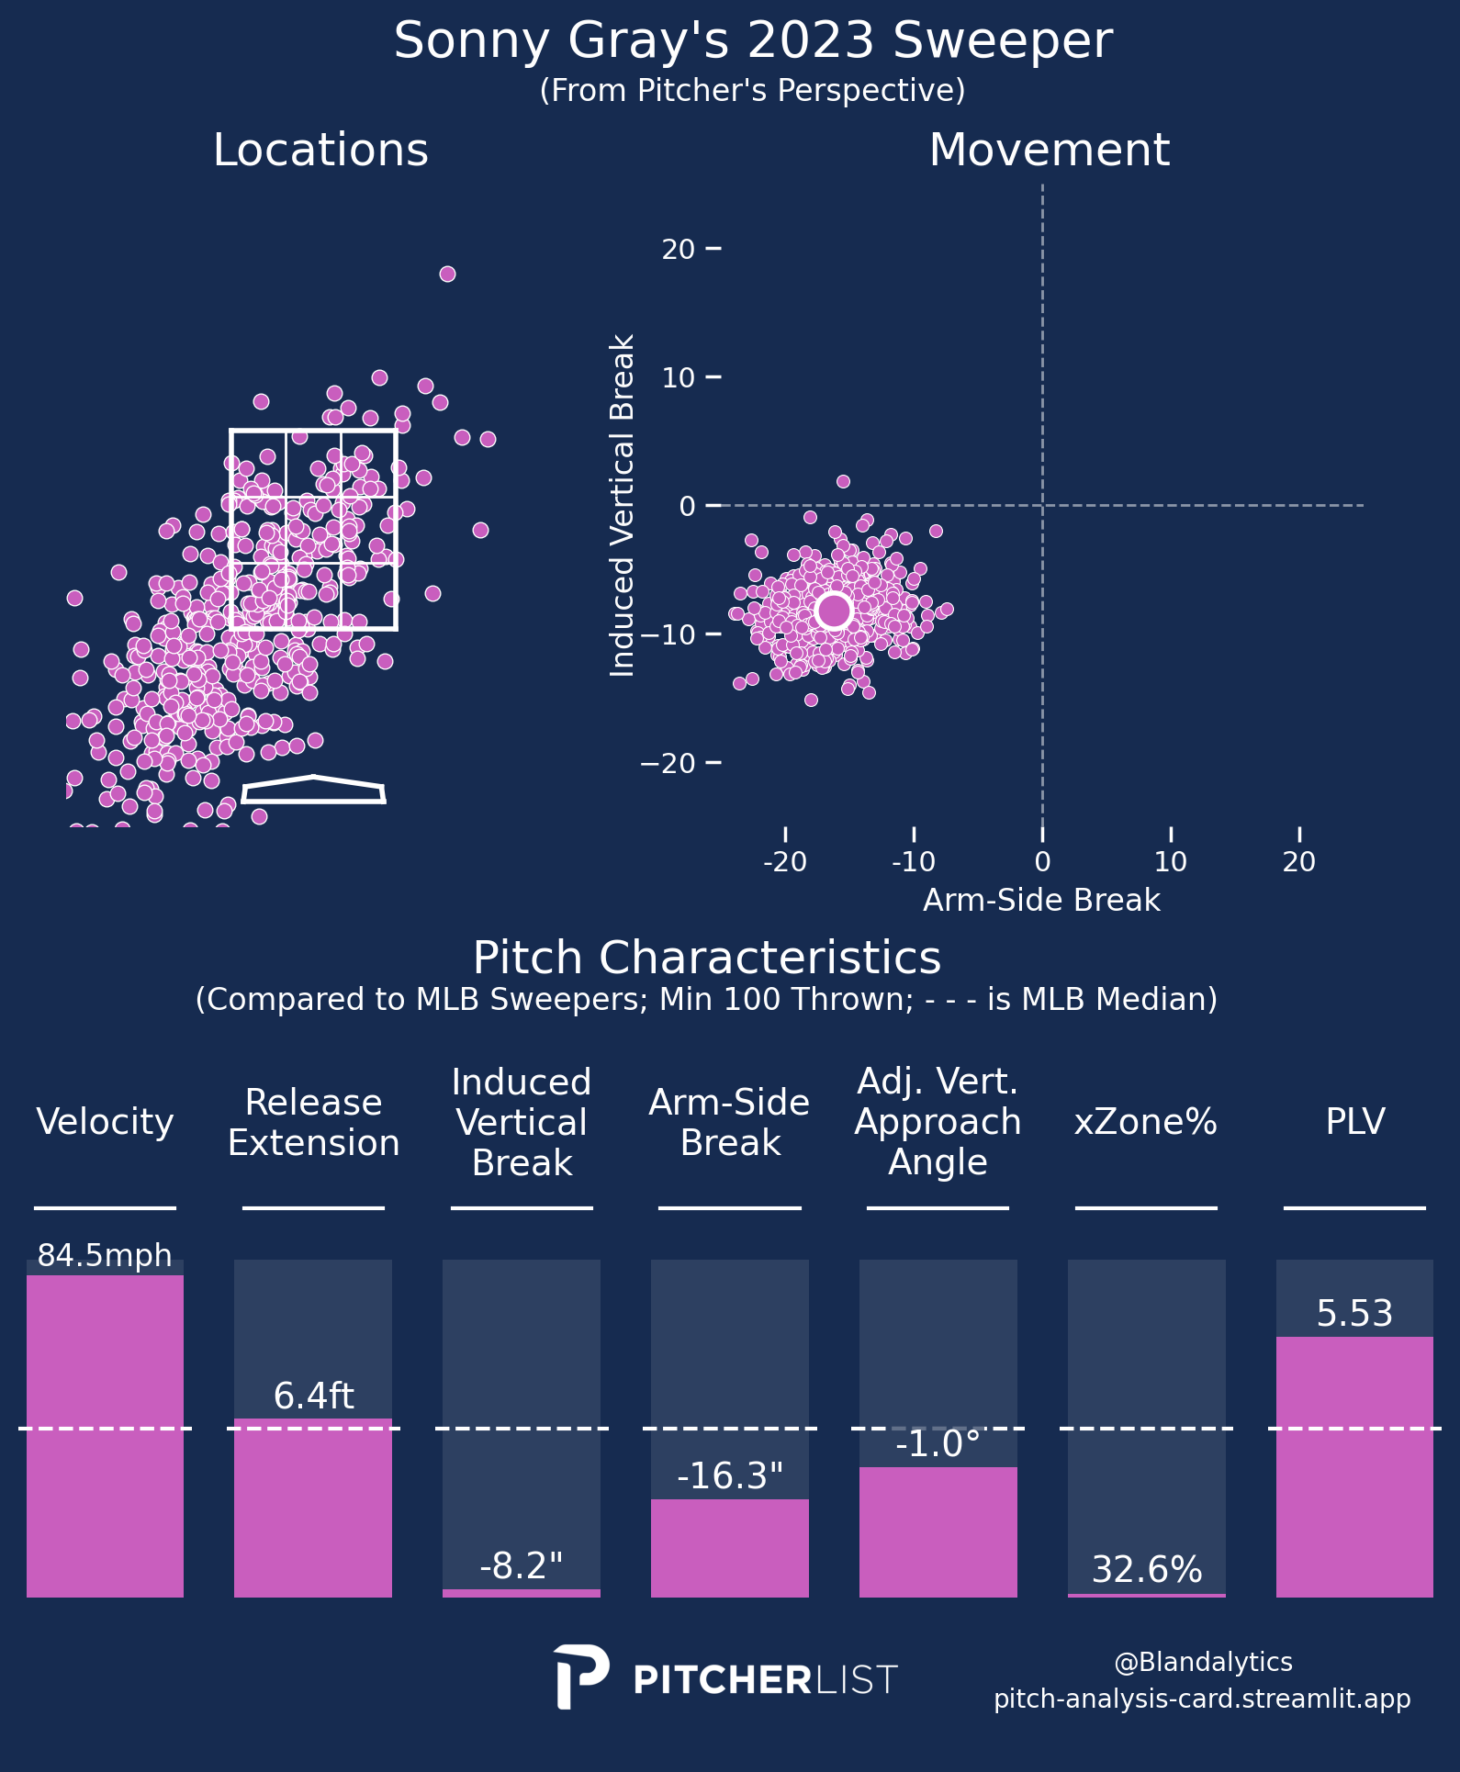
Sonny Gray might have one of the nastiest pitches in baseball in his sweeper. The fact that he has such a high PLV, but a low expected-zone rate shows how he is able to fool batters with it. He also throws it hard compared to other pitchers.
It also has insane drop, with 19% more vertical drop versus league average, which leads all sweepers. He also creates 17% more horizontal break on it versus league average, which is tied for eighth best in baseball.
Among pitchers who threw their sweeper in at least 75 PAs last season, Gray had the seventh-best whiff rate at 41% and the seventh-best putaway rate at 27%. So it is no surprise that Gray’s out rate on his sweeper is 10% higher than league average.
Check out Snell’s curveball:
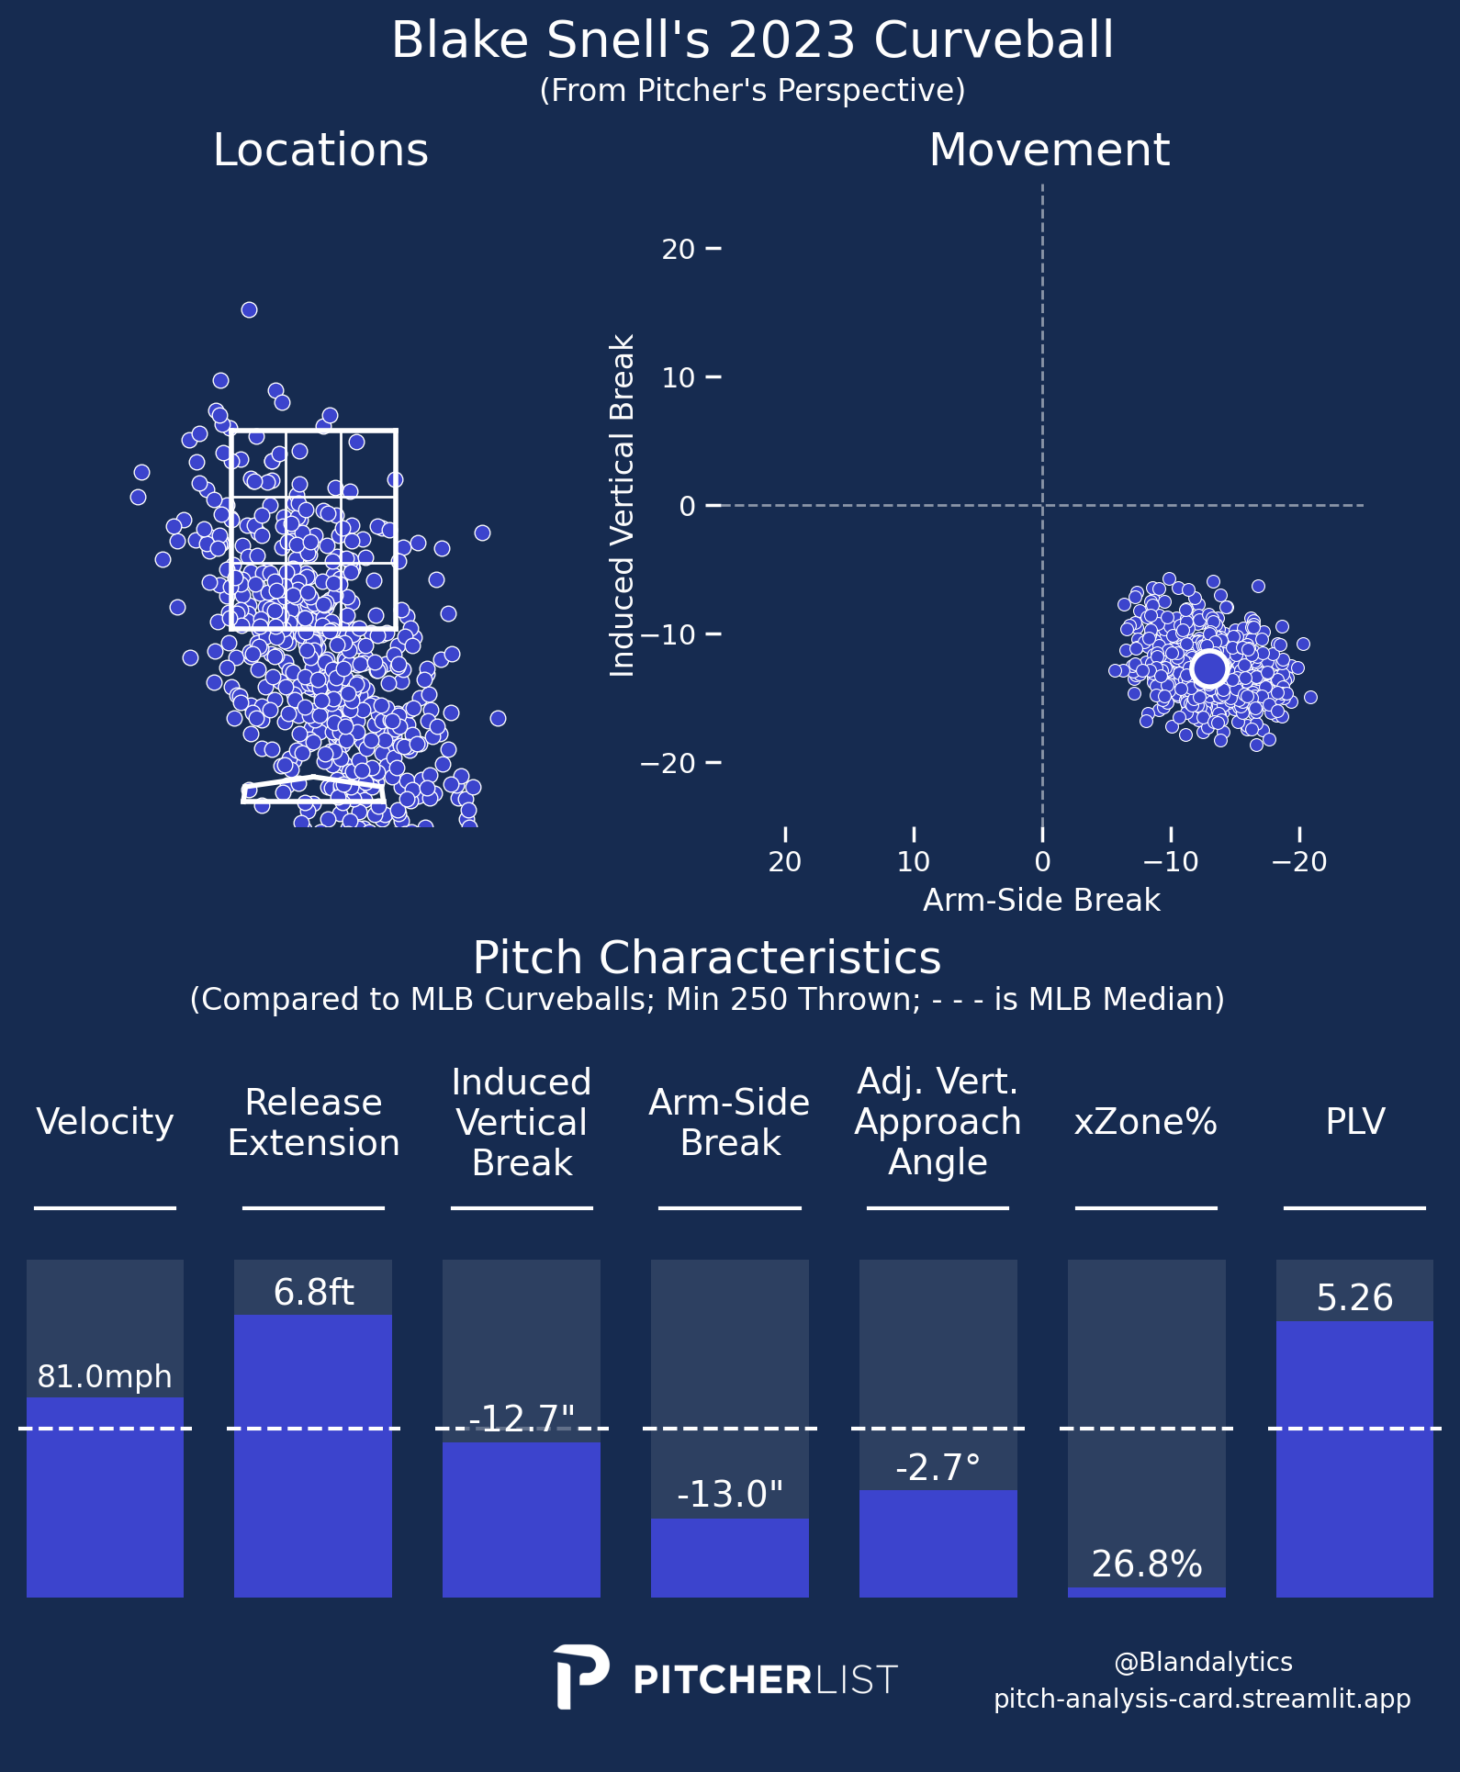
Blake Snell’s fastball is below league average at PLV and out rate, so he leaned on his curveball last season as his second-most-thrown pitch. It worked well for him, making him the leader in curveball out rate.
His PLV data helps show exactly how he managed such a high out rate, 6% higher than league average. He was able to get a ton of extension and while most curveballs would typically break vertically, Snell had 83% more break horizontally than league average.
The low xZone% shows a pitcher who did well at fooling batters. He was top-15 at Location+ on curveballs among qualified hitters. Among pitchers who threw a curveball in at least 50 PAs, Snell’s 56% whiff rate reinforces the notion that he was able to fool hitters so well.
His 33% putaway rate was third best for a curveball following the same parameters listed above, making clear why he was so successful at getting outs with it.
None of his other pitches meet league average for out rate, so if his curveball is not working for him, he may struggle.
This is Kremer’s cutter:
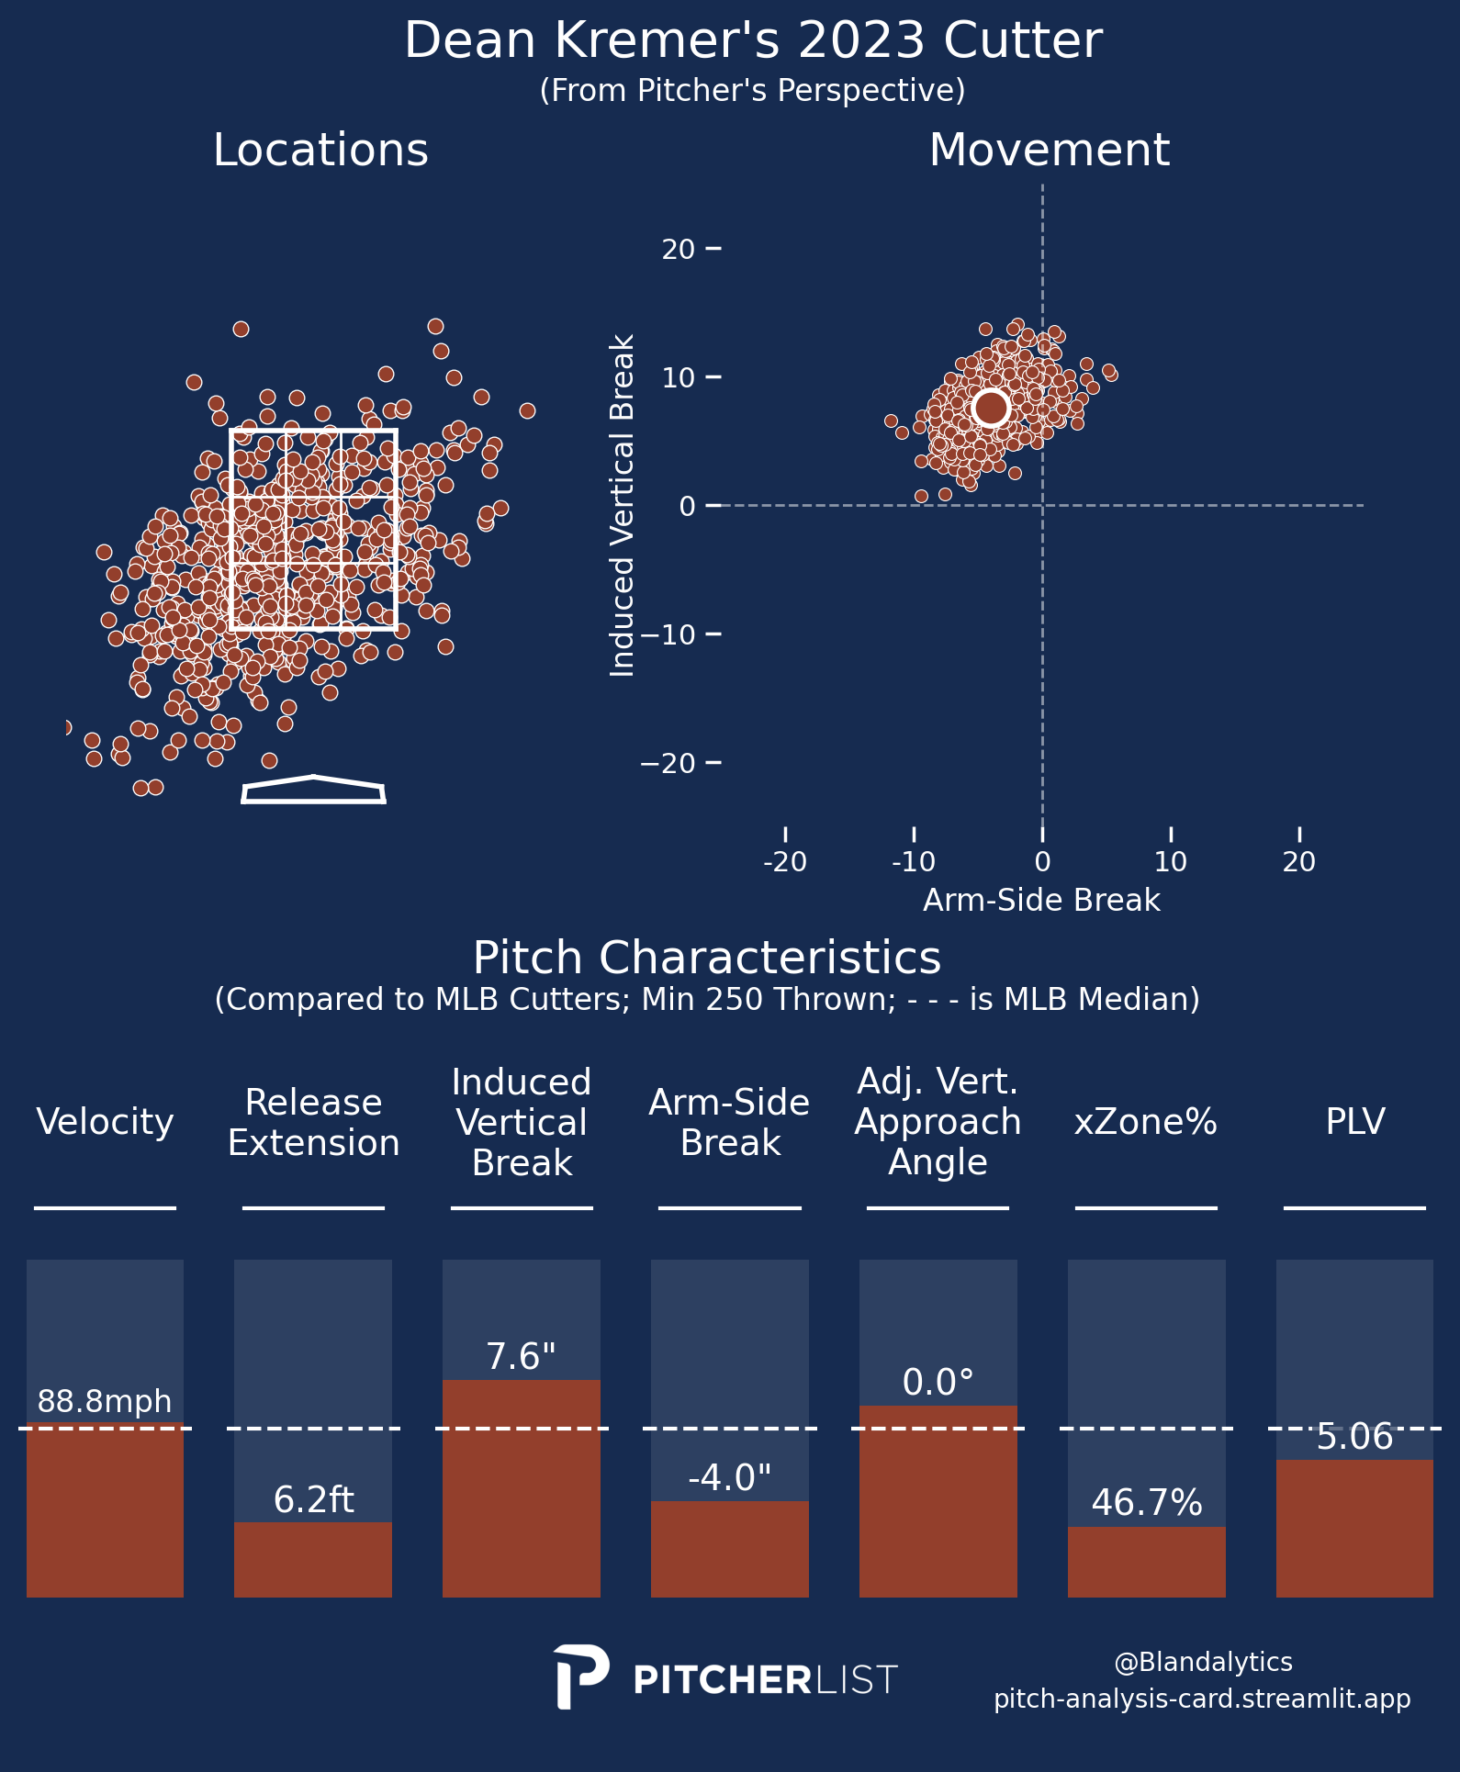
Dean Kremer’s cutter grades at just about league average for PLV, yet its out rate is 3% better than league average. He uses its vertical break and the approach angle to induce outs, rather than relying on speed or horizontal break.
Among pitchers who threw their cutter in at least 100 PAs last season, Kremer’s 27% whiff rate ranks eighth, and his 20% putaway rate ranks 12th.
What Kremer lacks in other quality pitches, he makes up for in pitch sequencing and deception. Playing his cutter off his fastball is a strategy that worked well for him last season and could continue working well for him this season.
And finally, here is Kirby’s fastball
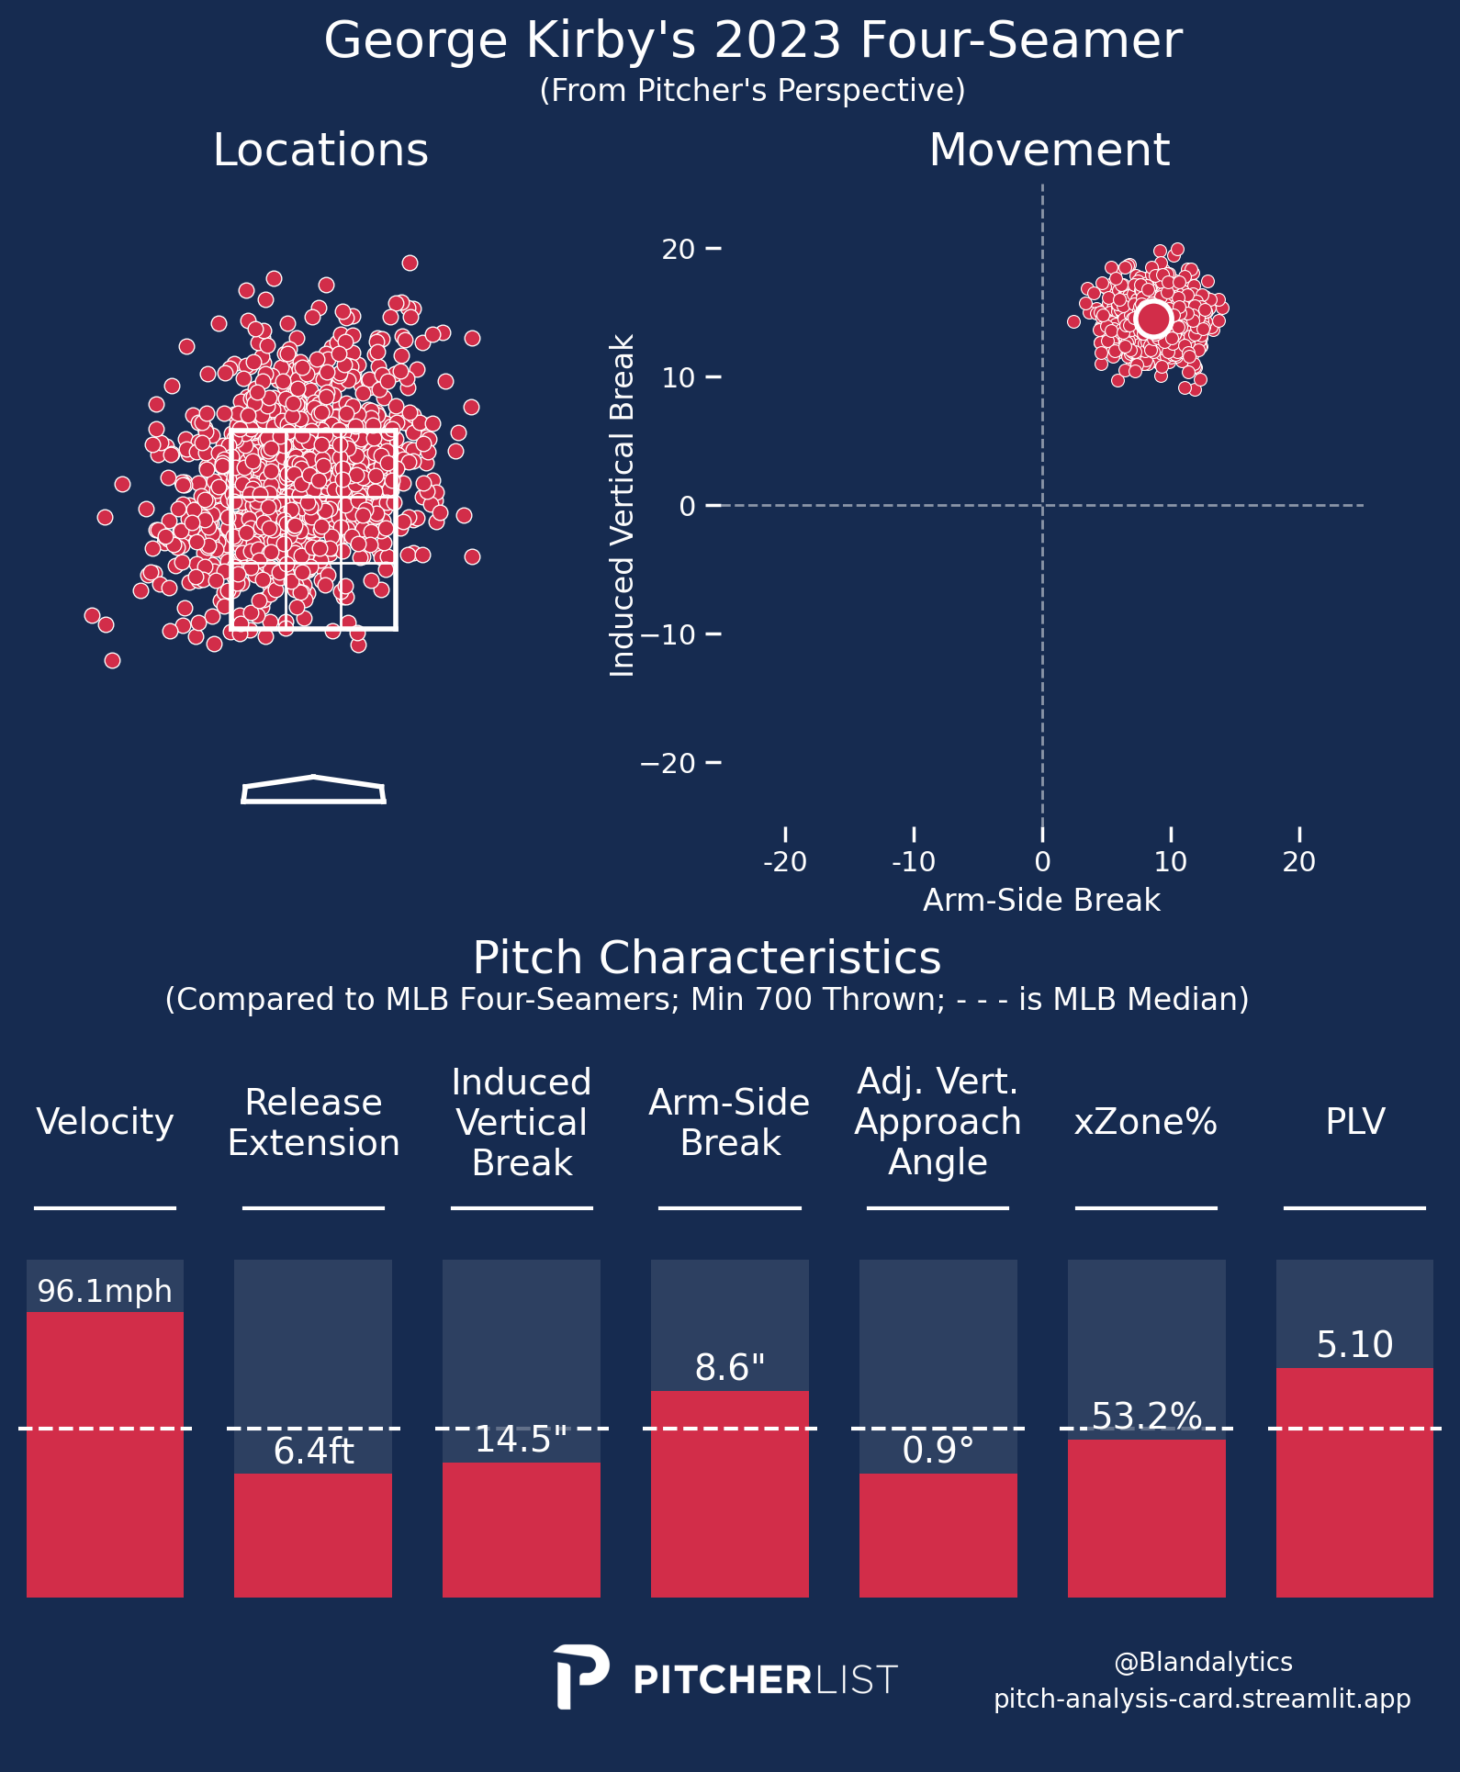
League average fastball velocity was 94.1 MPH last season. So Kirby’s average velo on his heater stands out. His arm side break also stands out, meaning his pitch is moving horizontally. Kirby also excels at locating his fastball. He was fourth in Location+ for his fastball last season among qualified pitchers.
This explains why his fastball out rate is nearly 5% higher than average. Last season, among pitchers who had at least 250 PAs against their fastball, Kirby’s 28% whiff rate was eighth best, and his 21% putaway rate was tied for seventh best.
Having such an exceptional fastball allows Kirby to get into favorable counts early where he can work his other pitches. His sinker and curveball are both above league average for out rate.
Limitations of Out%
Unfortunately, out rate is not predictive, and it is not “sticky” year to year. Because it factors in so many things out of the pitchers’ control, we cannot use out rate to realistically project a pitcher’s performance from one season to the next.
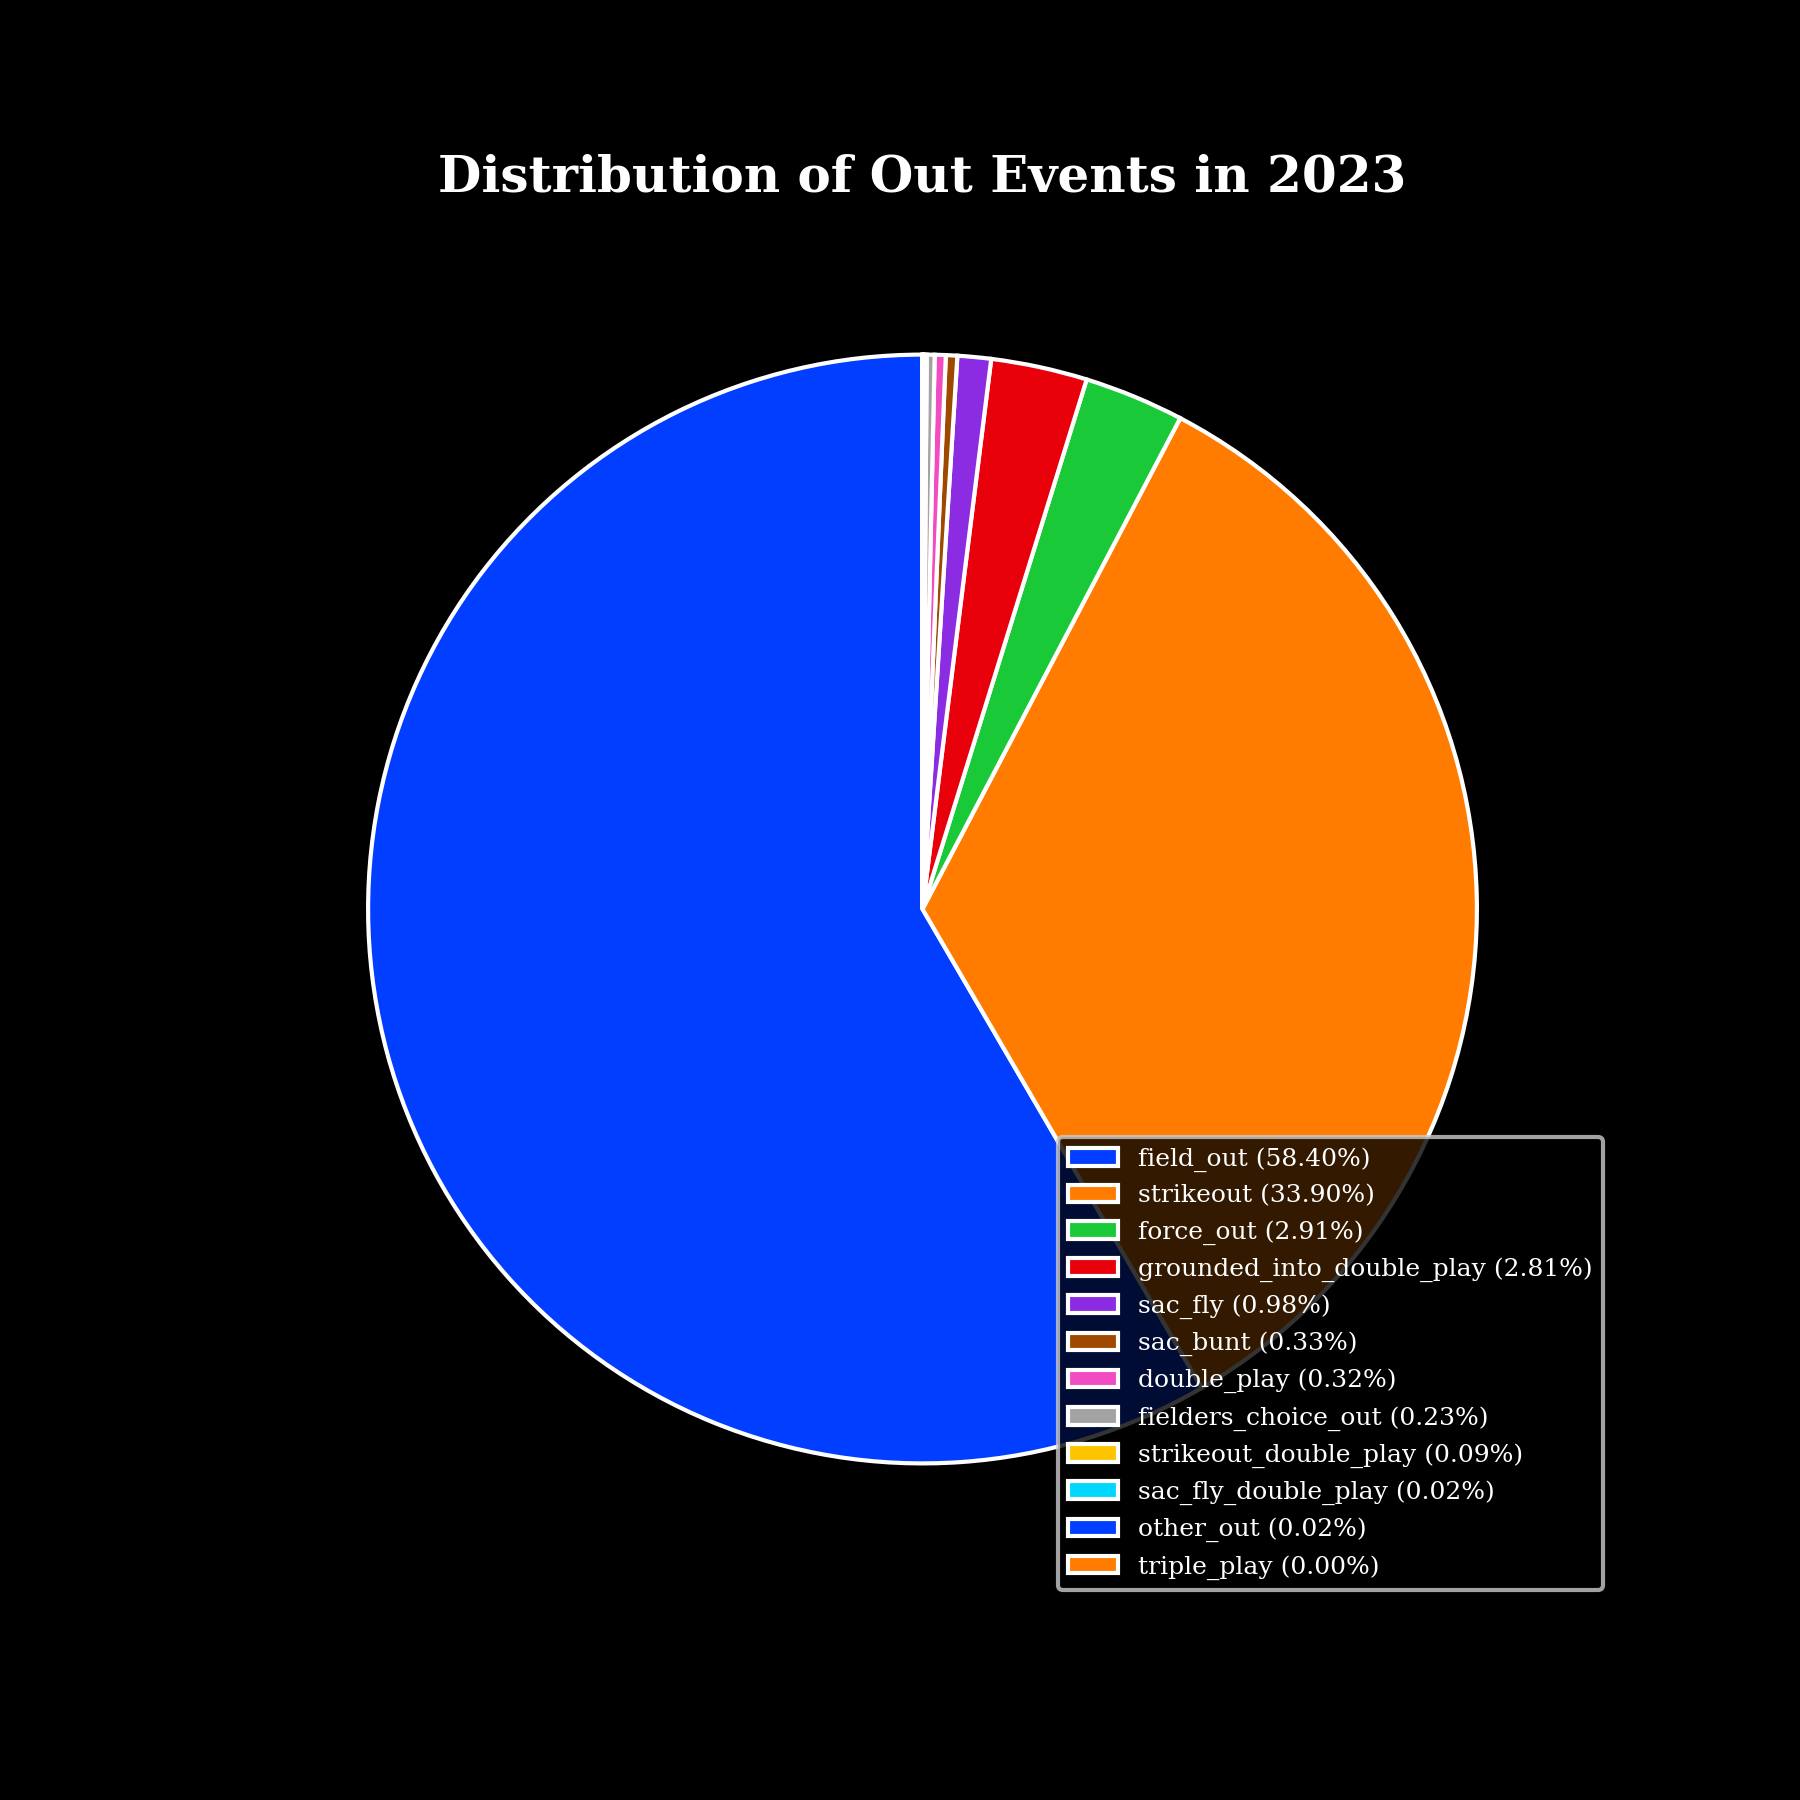
This is a display of out distribution from last season. Strikeouts make up about a third of the recorded outs from 2023, but the rest of the out events mostly are outs in the field. Yes, pitchers like Logan Webb and Framber Valdez are able to induce more groundballs because of their pitch types and locations, and plenty of other pitchers pitch to contact. But it largely rests on their defenses to help them get outs on groundballs and other types of balls in play.
Below is the R-squared for Out% from 2022 to 2023. What this does is measure exactly how sticky the stat is from year to year. A value of one means that what happens in the first year is exactly what happens in the second year, and a value of zero means that what happens in the first year does not influence what happens in the second year.
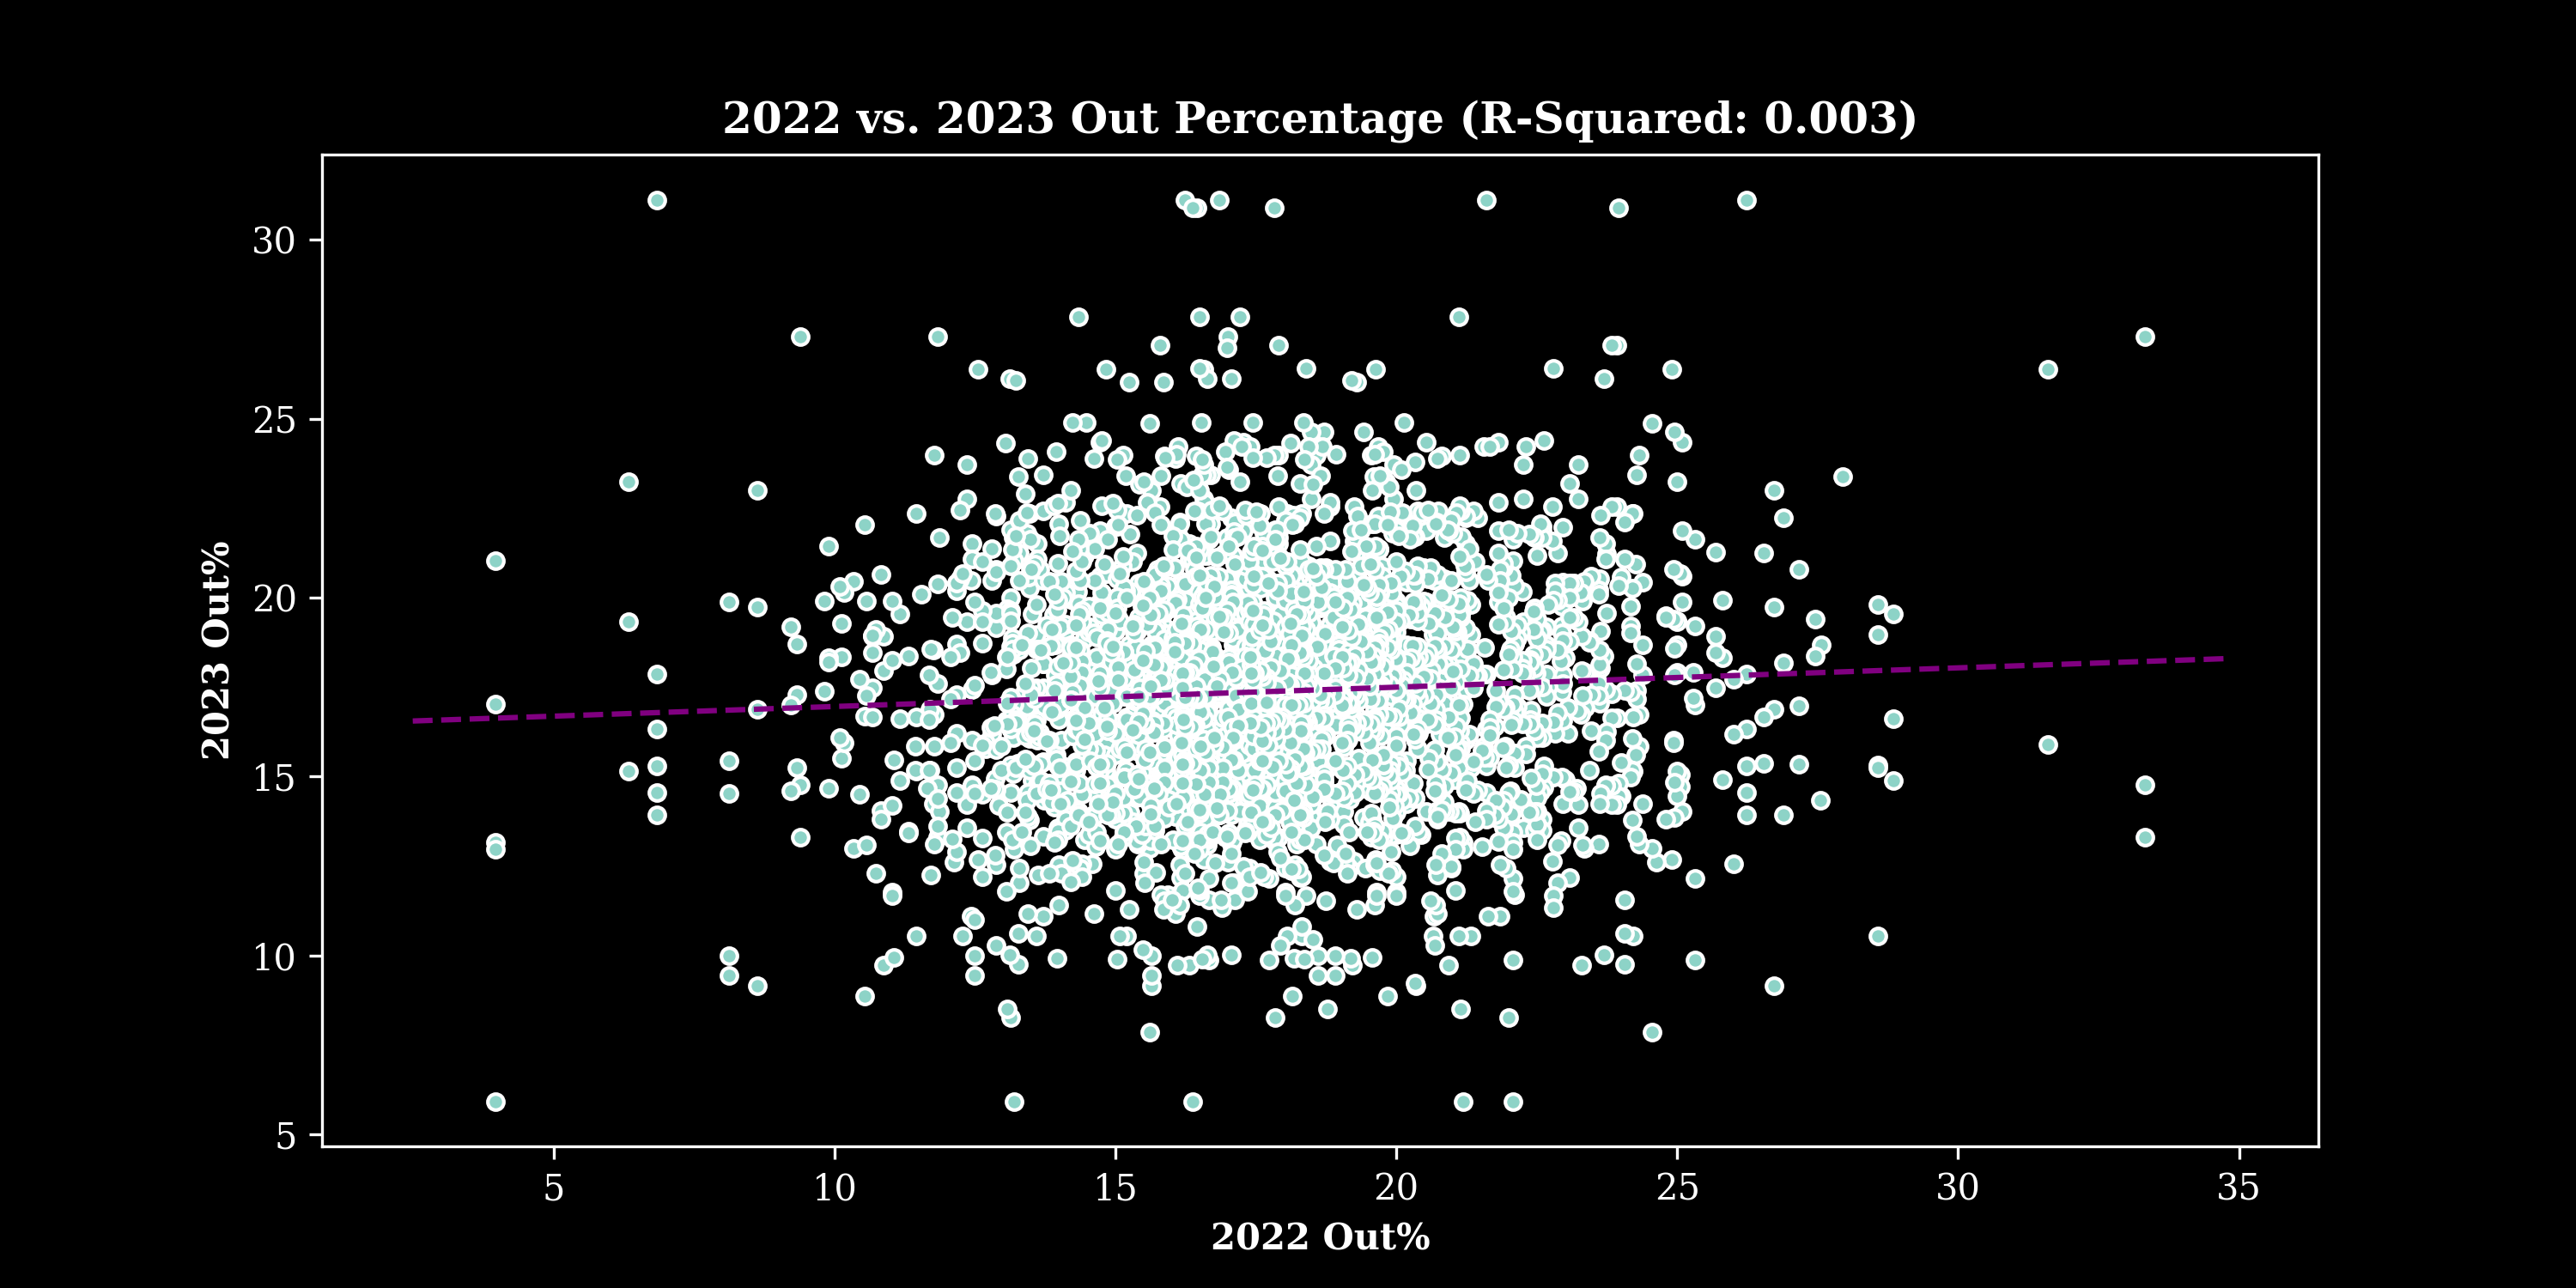
So basically, what this graph shows is that out rate’s R-squared is .003 (really close to zero), which means that what happens one year for a pitcher could be completely different from the following year.
For example, here is the R-squared for Mistake Rate:
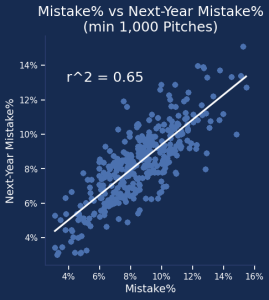
Mistake rate has an R-squared of .65 (closer to one), and the graph shows a slant. That is what you want to see when determining whether a stat is predictive from year to year.
For out rate, the line is closer to being flat, and it just looks like a big blob of dots. What this means for the pitchers is that they are about as likely to be better at getting outs the following season as they are to be worse at getting outs.
Despite its limitations, out rate does possess fantasy value, and absolutely should be something to monitor in-season.
How Do I Use Out%?
Out rate is best used in-season as a metric to track pitcher performance. It can be used in accordance with expected stats like xFIP and SIERA, which are more predictive and more focused on pitcher-specific factors, to identify pitchers who may be over or underperforming.
For example, take a low-strikeout pitcher like Bryce Elder. He finished last season with a 3.81 ERA, but his ERA was 3.18 through the end of July. He had a 6.6 strikeouts-per-nine rate, which was the fourth lowest among qualified starting pitchers, and the 12th-highest walks-per-nine rate.
His 3.18 ERA would have made sense if he was elite at inducing outs in other ways, but his out rate data actually reflects a below-average pitcher. Elder’s slider, changeup, and sinker each had below-average out rates. Only his fastball was above average. And from what we know about out rate, it’s important to have multiple pitches that get batters out above league average.
Knowing that, along with paying attention to his xFIP and SIERA (4.49 and 4.81 respectively), could have guided fantasy managers to drop him or trade him away. He ended up with just two quality starts in his final 10 games and did not make it through the sixth inning in six of those games. He gave up four earned runs or more in six of those starts and struggled to get outs in any form.
Dane Dunning is similar to Elder in that he is a low strikeout, high walk rate pitcher, whose 3.70 ERA was much better than his 4.39 xFIP and 4.52 SIERA. However, Dunning has multiple pitches that were above average in out rate. His slider and sinker were both above league average and major reasons why he was able to induce outs against both lefty and righty batters. So while fantasy managers could expect Elder’s regression last season from analyzing his out rate, fantasy managers also could expect Dunning to not regress as much as his expected stats suggested thanks to his out rate.
The real fantasy value with out rate is that you can find pitchers who have multiple ways to get batters out, rather than just relying on strikeouts or pitchers who pitch to contact and induce grounders. It can provide context, especially for low-strikeout, high-contact pitchers, and it can provide context to pitch level data.
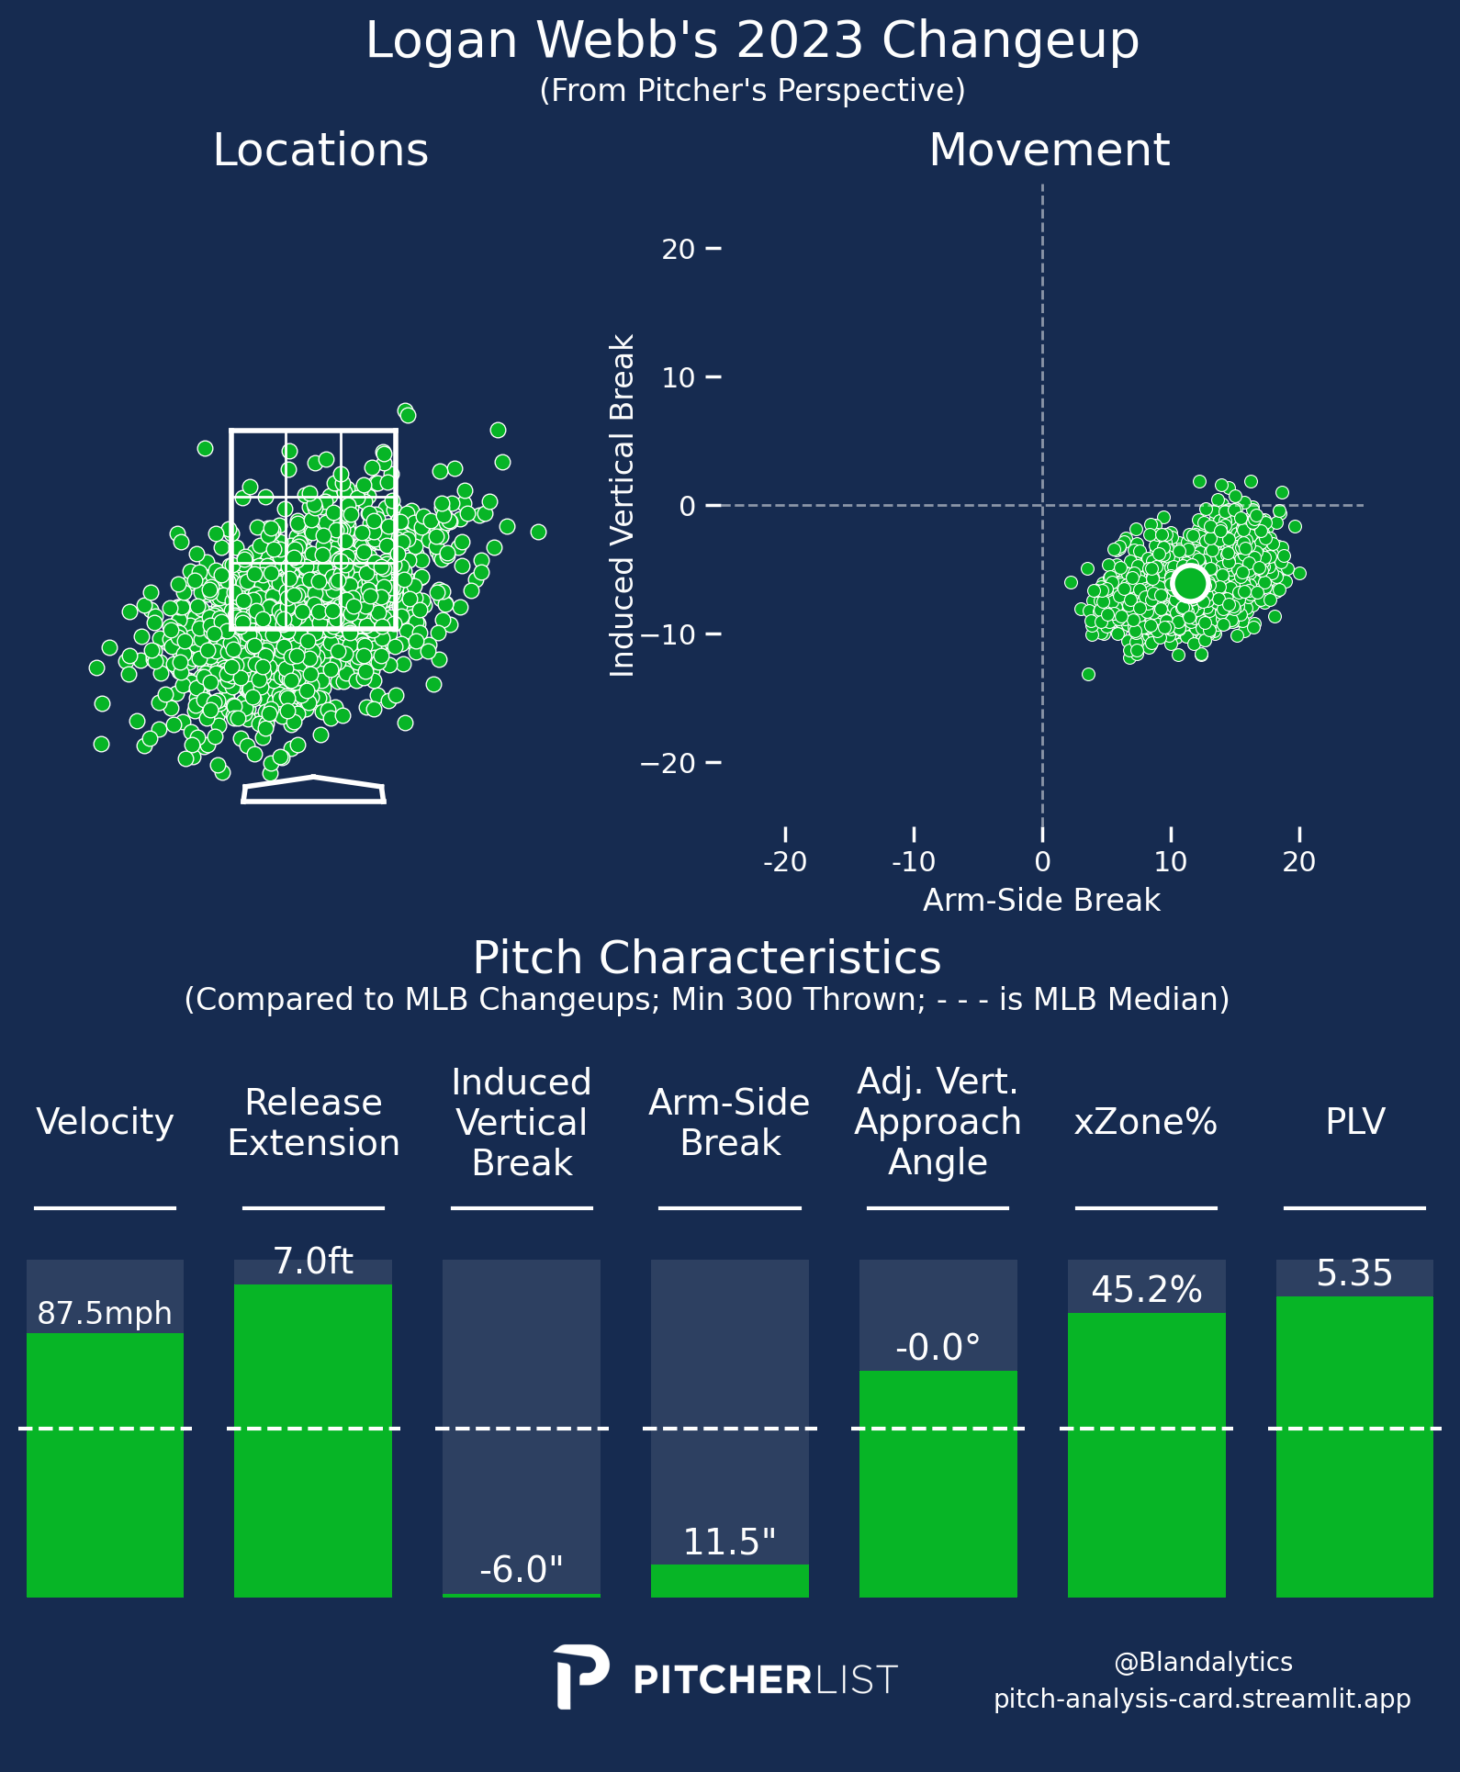
Logan Webb allowed the third most contact of any qualified starter last season at 81%, but he also had a league-high 62% ground-ball rate. A major factor in this was his changeup’s 24% out rate, which is 5% above league average. His changeup had a -5-degree launch angle allowed, but it only had a 19% putaway rate. It was arguably his best pitch at getting outs, even though he typically does not have a high strikeout-per-nine rate. Here’s how it looks according to PLV:
Perhaps slightly more off the radar is Merrill Kelly, whose 45% ground-ball rate tied Pablo López for 11th best among qualified starters. He allowed a 75% contact rate, and his sinker, changeup, and fastball all had an above average out rate. He was hugely valuable last season because he could induce grounders with contact, like with his sinker that allowed a .261 AVG but had a 25% putaway rate. But he could also get batters to miss with his changeup that had a 32% whiff rate.
Perhaps somewhat surprisingly, Seth Lugo also carries great value according to out rate. His sinker, fastball, and curveball all grade above average according to out rate, but he had a below-league-average strikeout-per-nine rate. He didn’t qualify last season, but among pitchers with at least 130 IP, he had a top-30 ground-ball rate at 45% and the 14th-highest contact rate. This suggests that even though Lugo’s pitches do not induce a ton of strikeouts, he can still get batters out with multiple pitches. His sinker is a great example, as it has just an 8% whiff rate and a 21% putaway rate. But Lugo also had a .206 BAA on his sinker, so out rate helps to provide the context on how he was getting batters out with it.
Pitchers that Out% Loves from 2023
Remember, out rate is not sticky, but here is a list of pitchers that out rate loved last season, along with some of their best pitches.
- Pablo López: Changeup, Fastball, Sweeper
- Brayan Bello: Changeup, Sinker
- Zac Gallen: Changeup, Fastball, Knuckle Curve
- Luis Castillo: Changeup, Sinker
- Michael Wacha: Changeup, Fastball
- José Berríos: Changeup, Sinker, Slurve
- Justin Verlander: Curveball, Fastball, Slider
- Nick Pivetta: Curveball, Fastball
- Framber Valdez: Curveball, Sinker
- Zach Eflin: Curveball, Sinker
- Jordan Montgomery: Curveball, Sinker
- Kyle Bradish: Curveball, Sinker, Slider
- Chris Bassitt: Cutter, Sinker, Sweeper
- Graham Ashcraft: Cutter, Slider
- Kodai Senga: Cutter, Fork ball
- Zack Wheeler: Cutter, Fastball, Sinker
- Jon Gray: Fastball, Slider,
- Johan Oviedo: Fastball, Slider
- Eury Perez: Fastball, Slider
- Mitch Keller: Fastball, Sinker, Sweeper
- Gerrit Cole: Fastball, Knuckle Curve, Slider
- Tanner Bibee: Fastball, Slider
- Shane Bieber: Fastball, Knuckle Curve
- Miles Mikolas: Sinker, Slider, Fastball
- Aaron Nola: Sinker, Knuckle Curve
- Cristopher Sánchez: Sinker, Changeup
- Ranger Suárez: Sinker, Curveball
- Sonny Gray: Sinker, Sweeper
- Freddy Peralta: Slider, Fastball
- Tanner Houck: Slider, Sinker
- Braxton Garrett: Slider, Sinker, Cutter
- Kyle Gibson: Sweeper, Sinker
My hope is that we will be able to track out rate in the near future, because that is where its greatest value lies. But for now, it is an exciting look into some of the best pitchers at getting batters out.
