


Here at PitcherList, we developed a statistic called Out% or Out Rate, meant to measure how good a pitcher’s pitches are at inducing outs.
Throughout the last two years, we have used it in-season to measure the effectiveness of a pitcher’s pitches. We have this nifty tool for collecting and analyzing the data, which you can also find here: https://pl-out-percentage.streamlit.app/
I published this article in 2024 describing what exactly Out% is and how to use it for fantasy and real-life purposes. And we have some awesome stuff coming your way in the next month as we further develop this stat into something that will be less reactive and more predictive.
For now, though, let’s take a look at what we learned from analyzing Out% in the 2025 season, and why it matters going forward.
What Do I Need to Know
Here are a few quick things to know about Out% before we get going.
- Out% is a stat that we measure against the league average for each pitch type. For example, the league average Fastball Out Rate was 16.4%. That means that 16.4% of fastballs resulted in an out league-wide. Brandon Woodruff had a 25% fastball Out Rate, meaning that a quarter of the fastballs he threw ended up resulting in an out. That is significantly better than average.
- Fastball Out% is important because it is a pitch typically used as a set-up pitch or waste pitch. Pitchers who use it to get outs have an advantage because it is like having an extra out pitch.
- Out% does not always line up with PLV and PLA data, but most of the time, if it is a high-quality pitch, the Out% and PLV/PLA will both reflect that.
- Out% is not a be-all-end-all stat. You should consider it in context with other data points to help paint a picture of a pitcher.
- Breaking ball Out% is extremely important. The higher the Out% of a high-quality breaking ball, the more a pitcher should be throwing it.
On that note, here is what we learned from Out% in 2025…
Final 2025 Out% Data
Below is the final data collected from last season for each pitch type’s league average Out%:
- Splitter (FS) = 20.9% (down .8% from the end of the 2024 season)
- Changeup (CH) = 19.5% (up .1% from 2024)
- Sweeper (ST) = 18% (down .7% from 2024)
- Slider (SL) = 18.5% (up .2% from 2024)
- Sinker (SI) = 17.9% (up .1% from 2024)
- Curveball (CU) = 17% (up .2% from 2024)
- Cutter (FC) = 16.1% (down .2% from 2024)
- Fastball (FF) = 16.5% (same as 2024)
What Do These Trends Mean for Fantasy Baseball?
We see it throughout the season that the league average Out% on individual pitches will fluctuate, but eventually will stabilize. Most of these pitches, aside from splitters and sweepers, had marginal or no change in the league average Out% from 2024. With some recent data updates, we have discovered that Out% is actually more of a “sticky” stat than we realized – meaning we can reasonably expect a pitcher’s performance with Out% to replicate from season to season, as long as they maintain their pitch quality. We can also reasonably expect Out% league averages to replicate within a certain point (a percent or less) from year to year.
Here’s what we found:
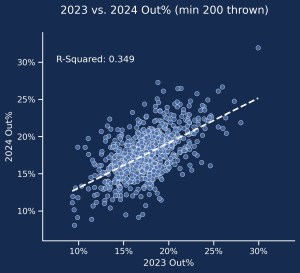
This display shows the Out% from 2023 to 2024, seeing if what happens in one year happens in the next. The closer the R-squared is to 1.0, the more “sticky” or repeatable it is. And the closer to 0, the less predictive. While Out% is not as sticky as something like mistake rate, it is relatively predictive. This means you can reasonably expect a pitcher to at least maintain their performance into the next season as long as they maintain pitch quality. Additionally, take a look at the R-squared from 2024 to 2025:
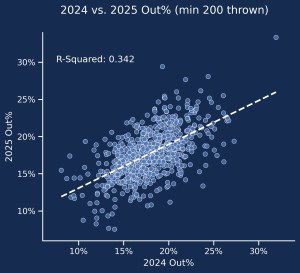
Not only does this also reflect some stickiness, but it is nearly identical to the R-squared from the previous season. This is a huge development for Out%, making it an essential factor in evaluating pitcher performance, both for real-life and fantasy baseball purposes, because of its predictiveness.
Another thing I noticed from 2023-2024 was that splitter usage increased significantly, with more pitchers throwing splitters in 2024 than in 2023. This trend continued in 2025, with ~5000 more splitters thrown this season than last. With so many more pitchers throwing splitters, the amount of bad splitters increased, which lowered the league average Out%. This is also true of both sweepers and cutters, which also saw significant increases in usage and decreases in average Out%.
What this could mean, as far as fantasy baseball implications, is that pitchers with high Out Rates on cutters, sweepers, and splitters have a slight edge on other pitchers. If these trends continue in 2026, it would be smart for fantasy baseball managers to target pitchers who are elite at getting outs with those pitches. Tomoyuki Sugano fits that mould, though his other two pitches – a fastball and sinker – were below average.
Here are pitchers who were above average in at least two of those three pitches in Out% last season:
- Dean Kremer
- Yoshinobu Yamamoto
- Garrett Crochet
- Jameson Taillon
- Randy Vasquez
- Tyler Mahle
- Ben Casparius
Another trend that has been clear for the three years we have data on Out% is that owning a fastball with an Out% above league average gives pitchers an advantage. Many pitchers use fastballs as set-up or waste pitches, but some use them effectively to earn strikes and get outs. We see this with relievers who often pair a fastball with just one or two other pitches. They need their fastball for outs, which is why relievers dominate the top of the fastball Out% leaderboard.
For fantasy managers, it is essential to find pitchers with high fastball Out Rates who also toss two or three other pitches with above-average Out Rates. Here are some pitchers with elite fastball out rates that also feature at least two other above-average Out% pitches:
What Do These Trends Mean for Real-Life Baseball?
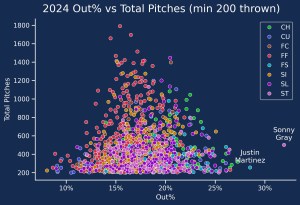
Let’s take a look at the overall pitch distribution from 2024:
And here it is from last season:
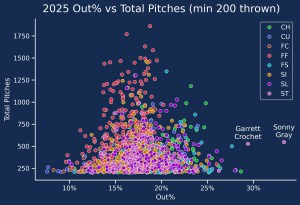
For two years running, Sonny Gray’s sweeper was the best out pitch in baseball. In the 2025 season, Garrett Crochet’s sweeper was a close second. Logan Gilbert’s splitter was once again one of the best out pitches in the league. This shows that for some of those high-quality pitches, pitchers seemingly do not fall off a cliff in Out% when they consistently have elite stuff.
Understanding Out%, especially with someone like Gray, helps make sense of some of his other data points, like strikeouts-per-nine. He maintained a 10 K/9 rate from 2024, which was an increase of two strikeouts per nine innings in 2023. Crochet also has an 11.8 K/9 rate over the last two seasons, thanks to his sweeper and a filthy cutter as well.
While Crochet’s elite out pitches helped him to high strikeout totals and an improved 2.59 ERA, Gray’s ERA did not line up with his pitch quality. Gray posted a 4.28 ERA, despite tallying similar or better numbers in K/9, BB/9, GB%, HR/FB%, LOB%, and LD%. The biggest issue for Gray was an inflated BABIP, which his 3.07 xFIP and 3.29 SIERA reflected. Additionally, Gray only owned two above-average out pitches. Turning his fastball into a good out pitch, or at least having a third effective out pitch, could have been the difference in his ERA ending up closer to his xFIP or SIERA. (One thing to consider is that Gray is in Boston now, with Andrew Bailey as his pitching coach. This is basically a match made in heaven.)
Pitchers have to rely on their defence for some outs, which is an issue we are looking into for the 2026 season as we make further developments with Out%.
As far as real-life implications of Out%, pitching coaches should be identifying pitches that are most effective at getting outs and should have pitchers lean on them. Pitchers should also limit the number of fastball and cutter waste pitches, and use them consistently to attack the zone, as long as the pitch quality is good. A good pitch that is thrown at a high rate with good location should lead to outs, and that has been proven year over year with Out%.
So, who were some of the best pitchers to own in fantasy baseball according to Out%?
Top Out% Pitchers
I have to thank Kyle Bland for running the numbers here (and all the graphics). He separated “qualified” pitchers as those who tossed at least 2500 pitches and had around 150 IP or more.
73 pitchers fall into the qualified category, and among them, three pitchers had four pitches graded as above league average in terms of Out%. They were Bryan Woo, Matthew Liberatore, and Nick Martinez. Liberatore and Martinez each tossed six pitches, so each had two pitches that were below league average in Out%. Woo, on the other hand, has all four pitches above league average.
Only one other pitcher had 100% effectiveness in Out Rate, and that was Jameson Taillon. All five of the pitches in his arsenal graded above average in Out%, though he threw just under 2,000 pitches total.
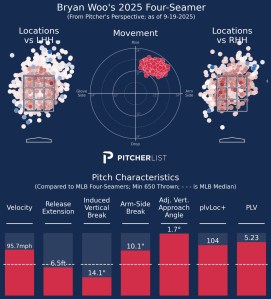
What this means is that, arguably, Woo can be considered the most effective pitcher in baseball in 2025. One pitch that makes him extremely dangerous for opposing batters is his fastball. It has an 18.5% Out Rate, which is above league average. Among pitchers who threw at least 750 fastballs in at least 150 PAs last season, Woo had the best BAA (.153), the fifth best whiff% (28%), the seventh best K% (31%), and the 11th best putaway% (22%). The only other pitchers in the top-11 in all four of those categories were Cade Smith and Hunter Brown. PLV data supports how insanely good this pitch was:
The eye test supports it too:
Bryan Woo, 96mph Expelliarmus Fastball. 🪄 pic.twitter.com/LvU65wE6wC
— Rob Friedman (@PitchingNinja) July 4, 2023
Woo’s above-average fastball velocity and above-average horizontal break, combined with the approach angle and elite location, all help this pitch grade as an above-average pitch according to PLV. He is next-level when it comes to spotting his fastball, but even more so with sequencing. He does not waste fastballs (let alone other pitches), with just 36 walks issued all season, but rather relies on them to induce outs, and does so at a high rate.
Woo also features a sinker, slider, and sweeper combination that makes him nearly unhittable.
Among qualified pitchers, his 2.94 ERA and 27% K rate each ranked 11th best, and his .198 BAA was sixth best. He also allowed the 10th fewest hits, the 12th fewest earned runs, and the third fewest walks among qualified starters.
Heading into the 2026 draft season, Woo should be considered as potentially the top pitcher off the board, even ahead of Tarik Skubal and Paul Skenes. Out%, PLV, and Statcast data all point to Woo being elite and showing repeatable skills, as long as he stays healthy.
As for Taillon, he is an excellent under-the-radar pitcher who could be extremely valuable late in drafts in 2026. For the second season in a row, he finished with a sub-4.00 ERA. His 3.68 ERA last season would have been 25th 25th-best if he qualified.
With five pitches grading above league average in Out%, it is no surprise that Taillon was successful. His fastball, changeup, curveball, cutter, and sweeper were all excellent. Additionally, all but his sinker graded as above league average in PLV:
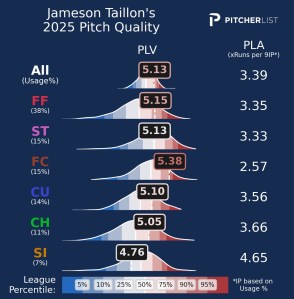
Taillon’s cutter was his best pitch according to PLV data, posting an identical PLV score to last season. This is despite some major changes to his pitch mix, where he saw his fastball and changeup usage tick up significantly, and his cutter and sinker usage decrease.
Still, his cutter worked wonders for him this season, even with some regression to it.BAA, whiff%, and putaway%. Here is how it looked according to PLV:
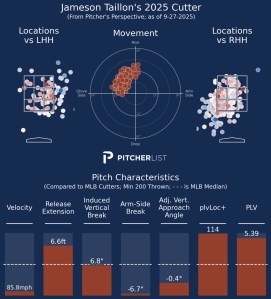
Taillon made up for the low velocity in other ways. He gets very good extension and about league-average vertical break. However, he tosses this pitch with absurd horizontal break and elite location. For perspective, among pitchers who threw at least 250 cutters last season, Taillon’s had three more inches of horizontal break than league average. And he had 4.2 more inches of induced horizontal break than league average. Both of those are good for third best within the aforementioned parameters. Take a look at it here:
Jameson Taillon’s evolution over the past few years has been fascinating, especially his cutter.
That cutter gets a lot more horizontal movement than expected—ranking in the 95th percentile for that separation. It’s basically a slider without the drop. pic.twitter.com/ybf7LJLTIs
— Brendan Miller (@brendan_cubs) December 6, 2025
Taillon ended the 2024 season with three pitches above league average Out%, and was one of my “Pitchers that Out% Loves for 2025” guys heading into the 2025 season. He will be someone I target in 2026.
To deepen our analysis, let’s take a look at the Out% leaderboards from the 2024 and 2025 seasons.
2024 Out% Leaderboard
Here is the final leaderboard after the 2024 season, based on the league average amount of pitches thrown for each pitch type:
- Fastball (16.5%) = Bowden Francis (21.9%)
- Cutter (16.3%) = Emmanuel Clase (20.8%)
- Sinker (17.8%) = Zack Wheeler (25.8%)
- Splitter (20.7%) = Bryce Miller (26.1%)
- Curveball (16.8%) = Blake Snell (23.6%)
- Slider (18.3%) = Derek Law (26.8%)
- Sweeper (18.7%) = Sonny Gray (32%)
- Changeup (19.4%) = Grayson Rodriguez (26.1%)
Here is the final leaderboard after the 2025 season, based on the league average amount of pitches thrown for each pitch type:
- Fastball (16.5) = Max Fried (20.9%)
- Cutter (16.1) = Chris Bassitt (21.4%)
- Sinker (17.9) =Miles Mikolas (24.2%)
- Splitter (20.9) = Logan Gilbert (28.2%)
- Curveball (17%) = Noah Cameron (22.6%)
- Slider (18.5%) = David Peterson (24%)
- Sweeper (18%) = Sonny Gray (33%)
- Changeup (19.5%) = Michael Wacha (24.6%)
There was some turnover here thanks to injuries and a few new faces in the majors, which leads to the next question…
Can They Repeat?
The big question, with so much turnover in the leaderboard for the top out pitches, is whether they can repeat their performance. And the answer is… It depends.
Not much has changed for Gray’s sweeper – that should remain an elite out pitch into next year. But what about some of these other pitchers and their top pitches?
To help tell the story of these pitches, we need to take pitch quality into account, along with some other factors. Out% only tells part of the story.
Max Fried
Max Fried’s fastball was the most effective in the league at inducing outs, and grades as a league-average pitch according to PLV.
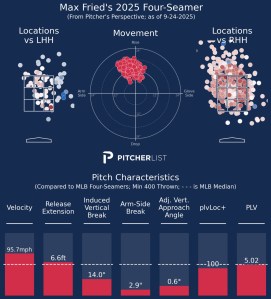
He manages above-average velocity and league-average location, but what helped him most was adjusting his pitch mix. In 2024, he used his fastball 32% of the time, the most in his arsenal. He dropped his fastball usage to 12% in 2025, and it worked wonders as he relied more on his cutter and sinker. In being more selective with his fastball, Fried improved it.BAA, whiff%, putaway%, and K%.
In particular, Fried’s fastball strikeout rate more than doubled from 15% in 2024 to 34.7% in 2025. His location also improved in 2025, possibly also relating to being more selective in not just when he threw it, but where he threw it. Check it out here:
Max Fried gasses up a 98.7 MPH fastball for a big strikeout pic.twitter.com/ayLCDuEhUv
— Talkin' Yanks (@TalkinYanks) September 13, 2025
We can also see that he was more aggressive at attacking the zone in 2025, taking his zone% to 51%, the second highest of his career. Attacking the zone more also led to a lower walk rate.
So, in adjusting his pitch mix and attacking the zone more, he improved his fastball Out% to elite levels, improved his walk and strikeout rates, and his ERA. Pay attention early in 2026 to see if these trends continue.
Chris Bassitt (FC)
Chris Bassitt overwhelmingly threw his sinker as his primary pitch, but his ssecond-most-usedpitch pitch was his cutter. It was extremely effective, turning in a 21.4% Out Rate, well above average. But is this repeatable for him? PLV would say it is unlikely:
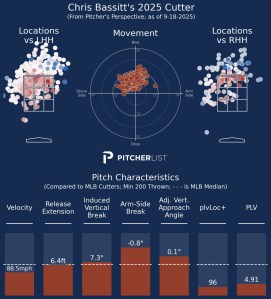
His PLV grade on his cutter is below average, thanks to tobelow-averagee velocity, extension, and location. However, his pitch had a .205 BAA, a .207 xBAA, a 29% whiff rate, and a 23% putaway rate. His arsenal featured eight pitches last season, which likely means his cutter was so effective because of how and when he was using it, not necessarily because it was a great pitch.
Similar to Fried, Bassitt attacked the zone this season, with a 54% zone rate. His ability to pound the zone with multiple pitches, while also being able to induce whiffs outside the zone, made him an effective pitcher this season. His sequencing clearly was a major factor in his and his cutter’s success in 2025.
Bassitt also benefited from a high-performing defence. The Blue Jays had the fourth-highest defensive runs saved above average at 51. They were also ninth in Stacast’s outs above average, and first in fielding run value above average, giving them the highest defensive score according to Fangraphs.
For his cutter to repeat as an effective out pitch in 2025, he would have to have similar success with his sequencing, and especially with his defensive support. Neither of those things is as guaranteed as pitch quality, so I would bet on some regression for Bassitt in 2026.
Miles Mikolas (SI)
Miles Mikolas owned baseball’s most effective sinker from last season, according to Out%. It was one of three pitches he threw that were above average in Out%. The others were his changeup and slider. Mikolas’ sinker looked great according to PLV:
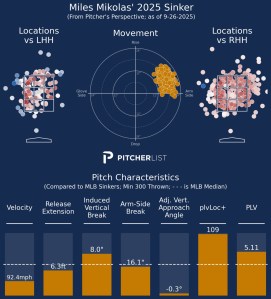
Despite the low velocity, he was able to get outs with it thanks to some decent horizontal break and elite location. Those qualities produced great results for Mikolas, including a 59% GB rate for the pitch. Groundballs turn into outs more than any other batted ball, so you can see why this pitch was so elite when it came to Out%.
Mikolas clearly knew who he was as a pitcher – his sinker had just a 10% whiff rate, meaning he was not blowing this past anyone – and pitched to contact. He located this pitch well, especially, and used it as his primary out pitch.
This is something he can certainly repeat if he were to return next season. He should be on the fantasy radar as someone to pick up as a streamer in the right matchups next season.
Logan Gilbert (FS)
As mentioned, Logan Gilbert’s splitter was one of the most effective out pitches in baseball among all pitchers and pitch types. Here is how it looked according to PLV:
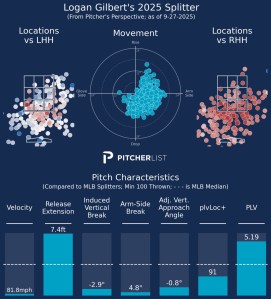
Do not let the low numbers fool you; this pitch was insanely good. You can see by the PLV that it graded above average despite the poor location and low velocity. Among pitchers who threw at least 100 splitters, Gilbert had the eighth most vertical drop compared to similar splitters. He also had the fourth most horizontal break at 4.8 inches of induced horizontal break. Imagine trying to hit this:
Logan Gilbert, Nasty 81mph Splitter. ✌️ pic.twitter.com/VhYCRuOpVK
— Rob Friedman (@PitchingNinja) October 20, 2025
It is no surprise to see some of the numbers that resulted from his splitter. It had a .119 BAA, a 50% whiff rate, a 63% K rate, and a 27% putaway rate. Among pitchers that tossed at least 100 splitters, those rank third, third, first, and fifth, respectively.
If Gilbert can remain healthy next season and get his pitches back to where they were in 2024 (all five were above average in Out%), we could be looking at a top-10 or even top-5 pitcher.
Noah Cameron (CU)
Noah Cameron debuted for the Royals in 2025, finishing the season with a 2.99 ERA and a 7.4 K/9 rate. A major reason for his success was an absolutely filthy curveball.
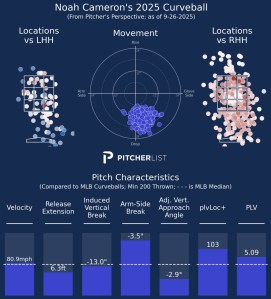
This was Cameron’s best pitch by far. It graded above average according to PLV and finished as the best curveball in the league, in terms of Out Rate. He located his curveball well, while also getting some insane break on it. Those factors led to a .153 BAA, a 30% whiff rate, a 37% K rate, and a 24% putaway rate. Among the 63 pitchers who threw a curveball at least 300 times last season,r ranked in the top 255 except for his whiff rate.
Cameron’s curveball also resulted in a 50% GB rate, meaning that he was not just relying on its movement and location to get outs, but he was earning batted ball outs with it, too. The Royals were the 10th-best defence according to Fangraphs’ defensive score, which also helped Cameron succeed.
While his curveball was excellent, Cameron also tossed an above-average fastball and slider, according to Out%. That bodes well for his long-term success, but it would be better if he could develop his changeup into a better out pitch. He has the weapons to get lefty batters out, but will need to develop the changeup as an out pitch against righties. If he can do that, he may stave off some regression in 2026.
David Peterson (SL)
David Peterson was the slider Out% leader nearly wire-to-wire in 2025. It was his third most used pitch, but arguably was his best, and should have been tossed much more.
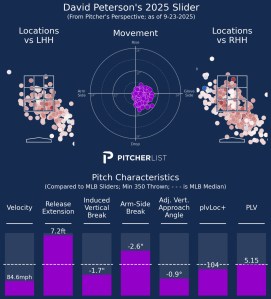
Peterson made up for below-average velocity with elite extension. That gives batters less time to react, and every millisecond counts, especially with sliders that move like Peterson’s. He relies more on vertical movement than horizontal, with the 13th most inches of vertical drop among pitchers who threw at least 500 sliders last season. That led to an above-average PLV score on his slider, when also combined with solid location. Even when he misses the zone, he can still get positive results:
David Peterson, Nasty 85mph Slider…and Sword. ⚔️ pic.twitter.com/2EGgXDrvvL
— Rob Friedman (@PitchingNinja) August 24, 2025
Peterson improved his slider’s whiff rate from 2024, with a 38% whiff rate last season. His slider also saw improvements to BAA (.228), K% (40%), and putaway rate (28%). These improvements could be for many reasons – a higher usage rate, location (it was his best located pitch), and sequencing. Either way, Peterson should be able to continue to improve or maintain this pitch’s effectiveness.
Peterson’s curveball was his only other above-average Out%. He needs to develop his fastball or changeup into a better out pitch, and if he can do that, he may move from a top-50 pitcher into the top-25.
Michael Wacha (CH)
Michael Wacha’s changeup is a thing of beauty:
Michael Wacha, Dirty 81mph Changeup. 👌 pic.twitter.com/4ee9FiTthD
— Rob Friedman (@PitchingNinja) July 1, 2025
That pitch has been a huge reason for his success the last four seasons – all of which he has pitched to a sub-4 ERA. Despite the lack of strikeouts, Wacha was able to turn in another great season, outpitching his advanced ERA metrics. Here is a look at how he did that:
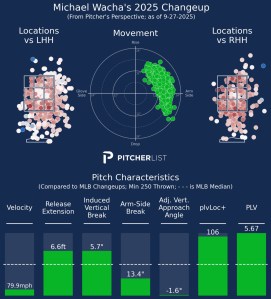
Wacha is not a hard thrower, so he had to be effective in other ways last season. His changeup combined above-average extension, serious break, and elite location to make it a Quality Pitch according to PLV.
It was nearly impossible for opposing batters to hit, resulting in a .172 BAA and zero home runs against it. Yep, you read that correctly. In the 677 times Wacha threw his changeup, not a single batter sent it out of the yard.
Wacha’s changeup featured 35 inches of vertical drop, which was the seventh best among pitchers who threw at least 500 changeups. His induced vertical break was sixth best.
Many may predict Wacha will experience regression in 2026 thanks to the low HR/FB rate, but it has been creeping down the last few seasons, as has his walk rate. These are not necessarily flukes, but rather developments in his arsenal. He makes for a great choice as a back-of-the-rotation arm in fantasy baseball for 2026.
How Can I Use Out% in 2026?
Stay tuned for an article coming out with some updates to Out% in 2026. We will be making some improvements and fine-tuning it to help factor in some things outside of the pitcher’s control. Hopefully, with the added data, we continue to develop Out%’s stickiness.
Aside from that, Out% is an excellent tool for tracking pitcher performance during the season and finding gems to target in fantasy baseball.
Cross-referencing Out% data with other data points like PLV and Statcast can help sus out whether pitchers are the real deal or if they are a flash in the pan. Finding pitchers with high-quality pitches that use them well is just common sense, and Out% helps you do that.
Analyzing Out% can tell you whether you should ride it out with a pitcher who has an inflated ERA or if you should jump ship.
Out% can also be used as a guide for finding pitchers to target as buy low and sell high candidates, all based on identifying which pitchers are getting good outs with good pitches – something we will look deeper into going forward.
Pitchers That Out% Loves for 2026 (at least 4 pitches with an Out% above league average in 2025)
- Jameson Taillon (5)
- Bryan Woo (4)
- Matthew Liberatore (4)
- Nick Martinez (4)
- Cade Horton (4)
- Ryan Yarbrough (4)
- Stephen Kolek (4)
Pitchers That Out% Likes for 2026 (3 pitches with an Out% above league average in 2025)
- Zack Littell
- Michael Wacha
- Miles Mikolas
- Paul Skenes
- Mitch Keller
- Tomoyuki Sugano
- Dean Kremer
- Kyle Freeland
- Matthew Boyd
- Tanner Bibee
- José Berríos
- Zac Gallen
- Nick Lodolo
- Yoshinobu Yamamoto
- Grant Holmes
- Drew Rasmussen
- Noah Cameron
- Shane Bieber
- Emmett Sheehan
- Clarke Schmidt
- Luis Morales
- Spencer Schwellenbach
- Bryce Miller
- Tobias Myers
- Michael Lorenzen
- Slade Cecconi
- Randy Vasquez
- Janson Junk
- Ranger Suárez
- Adrian Houser
- Eric Lauer
- Shohei Ohtani
- Bailey Falter
- Trevor Rogers
- George Kirby
Good luck in your leagues in 2026!
