


Here at Pitcher List, we have a suite of PLV metrics to analyze every pitch in a baseball game. Decision Value (DV) is our hitter swing decision metric. It takes inputs like pitch velocity, location, and movement, and tells us whether the hitter made a good decision to swing or take a particular pitch. This isn’t quite as simple as plate discipline; swinging at a Logan Webb sinker and pounding it into the ground is a bad outcome even if the pitch was a strike.
Instead, Decision Value rewards hitters for swinging at pitches they should be able to hit hard, and for taking pitches they’re unlikely to do much with. The flipside is that Decision Value punishes hitters if they don’t swing at pitches they should be doing damage on or do swing at pitches that are unlikely to generate quality contact. You can find a much more thorough introduction to PLV metrics and Decision Value here.
In today’s edition of PLV DV Weekly, we’ll be looking at some of the better-performing hitters in their second year in the majors. Rookies are typically the focus of more attention, but we’re still learning a lot about hitters with just one season of experience. Some of today’s brightest stars have made significant changes between year one and year two. Elly De La Cruz cut his chase rate by 6 percentage points in his sophomore season, while Jackson Chourio’s oSwing and zSwing both spiked nearly 5 percentage points in his second year in the majors.
Liam Hicks: .278/.359/.472, 106 DV
Hicks is perhaps the biggest surprise on this catcher-heavy list. Hicks had an exceptional April, putting up a .941 OPS and 7 homers. After cooling off in May, he’s raking again in June. Despite some slippage in his power numbers relative to April, Hicks has compensated by ramping up his walk rate closer to the 11% he put up as a rookie.
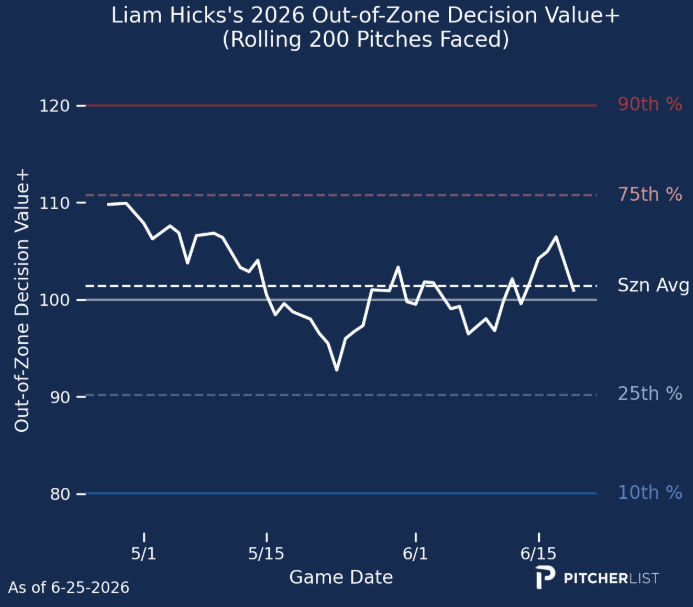
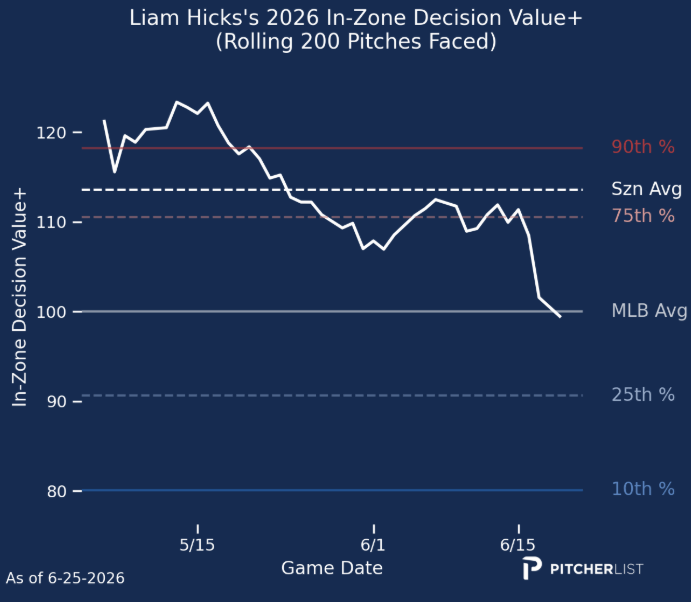
Hicks started the year as a swing decision all-star. He was particularly strong at attacking the right pitches in the zone, a skill that has eroded as the season has progressed, particularly in recent weeks. In his hot April, Hicks swung at 71% of pitches in the Statcast-denoted heart of the zone. His swing rate on more marginal pitches was 49%, giving him an overall zone swing rate of 65%. Hicks chased only 24% of pitches outside the zone, giving him an excellent 41% margin between zSwing and oSwing. Since April, Hicks has lost some of his aggression inside the zone. He’s swinging at 64% of pitches in the heart of the zone and 42% in the shadow. His chase rate is still excellent at 28%, but his zSwing minus oSwing has declined to 27% from 41%.
Hicks needs to recapture his early-season decision-making ability if he’s going to maintain his offensive breakout. Hicks has poor bat speed, ranking in the 6th percentile among MLB hitters. The result is that Hicks doesn’t make hard contact, nor does he do so at optimal launch angles. All of his home runs, and all but two of his extra base hits, this year have been pulled to right field – this is an Isaac Paredes power profile, not someone with the juice to leave the park to all fields. Instead, what Hicks excels at is making solid contact when he does swing. If Hicks is going to have the shot to hit 20 homers consistently, he needs to give himself as many opportunities as possible on hittable pitches.
Jac Caglianone: .272/.344/.490, 79 DV
The emergence of Jeffrey Alan Caglianone this summer is the most exciting story for a disappointing Royals team. JAC is known for his extreme bat speed and loud contact, but has correspondingly large weaknesses in his chase and contact rates. Jac’s 80 DV, more than a standard deviation worse than average, is a marked improvement on the 66 DV he showed in 2025.


I feel like my Star Wars name doppelganger, screaming “MORE” at the screen every time Caglianone swings at a strike. My first article here at Pitcher List was an optimistic look at Jac, arguing that the biggest flaw in his profile was his below-average aggression in the zone. In June, corresponding to Caglianone’s breakout, where he’s hit for a .354/.433/.734 line, Jac has been swinging at 81% of pitches in the strike zone. He’s swung at 82% of pitches he’s seen in the heart of the zone, up from 73% on the season. He’s swinging at pitches around the edges of the strike zone 75% of the time, up from a season rate of 62%. Despite the increased aggression in the zone, he’s chasing just 0.3% more of the time than his season average, and has actually cut his swing rate at waste pitches well out of the strike zone. It would be great if Jac could be a bit more discerning at the plate, but if he’s going to chase upwards of a third of the time, he needs to maintain the in-zone aggression he’s been showing.
Dillon Dingler: .267/.333/.535, 93 DV
Dingler had an excellent rookie season in 2025, adding 4.1 WAR over 126 games for the Tigers. A huge chunk of that is thanks to his defense; Statcast says he’s the best framer in baseball this year, in the 97th percentile for blocking, and above average at controlling the running game. His bat was a positive too, though, hitting .278/.327/.425. In 2026, his offensive output has exploded. Dingler has added a few walks, cut some strikeouts, but most notably has added 120 points of ISO.
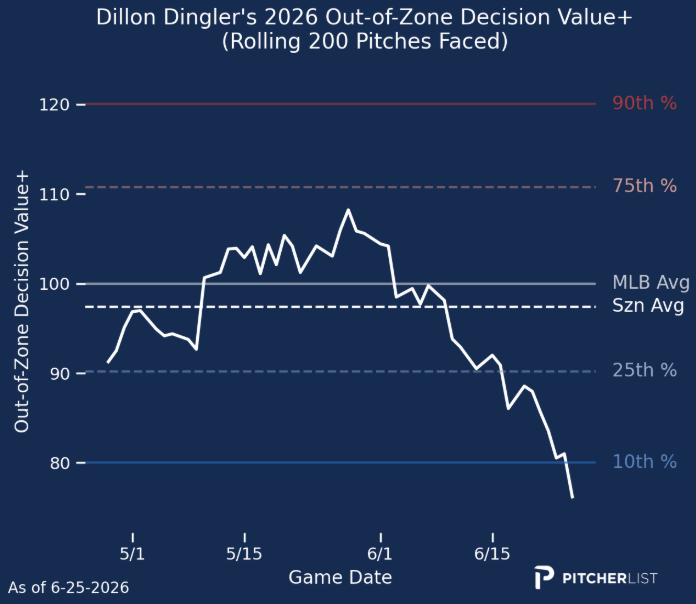
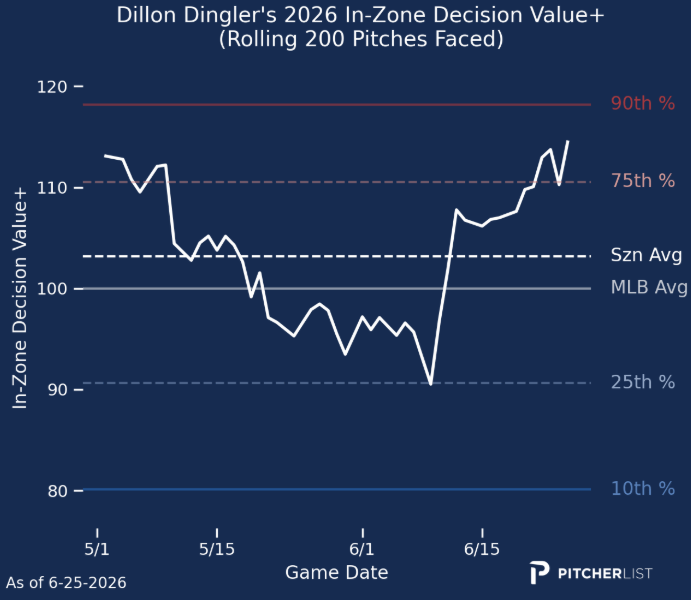
Like Caglianone, Dingler has had a monster June, which has coincided with increased aggression at the plate. Unlike Caglianone, Dingler makes close to average swing decisions. The two AL Central breakout stars have shared a big increase in zDV and a corresponding decrease in oDV during their strong Junes. In Dingler’s case, he’s swinging 70% of the time in the zone in June, up from 64% on the season. He’s also chasing 38% of the time, up from 35% on the season.
Dingler’s swing decisions at the plate are a bit more curious when compared against himself a year ago. He’s chasing 4.5 percentage points more often, which is a substantial change for the worse. His oDV has only decreased by a point from 2025, though. The changes could be due to a couple of things. First, he could be targeting what he’s swinging at outside the zone a bit better. After all, not all balls are created equal. There’s conflicting evidence for this theory. On the one hand, Dingler’s contact rate on balls has jumped 10 percentage points vs 2025. If he’s swinging at better pitches to hit, it could explain the increase in his contact rate outside the zone despite a worse chase rate. On the other hand, he’s swinging at 12.5% of “waste” pitches, up from 5.8% last year, and hasn’t made contact with any of them. It’s hard to argue that swinging at the most obvious balls constitutes an improvement in what he’s swinging at.
I think what’s more likely is that pitchers are throwing Dingler fewer strikes, both as a consequence of the new ABS strike zone and because of his newfound power. Pitchers are in the zone 47% of the time against Dingler after throwing him 54% strikes last year. Looking at the Zone% leaderboards this year, Dingler’s 2025 would lead MLB by over a full percentage point. That’s usually territory reserved for the least dangerous on contact bats. Luis Arraez is tops in Zone% this year, with a combination of contact bats like Caleb Durbin and Chandler Simpson, and struggling older players like Marcus Semien and Alex Bregman filling out the top 10. Dingler’s current 47% zone rate is 85th of 154 qualified hitters in MLB; he’s just getting enough volume of bad pitches to make up for some slippage in his chase rate.
Drake Baldwin: .268/.349/.486, 85 DV
Baldwin has had a strong season thus far despite missing a month with an oblique strain. The 25-year-old catcher, combined with a consistent stream of injuries, has dethroned incumbent Sean Murphy. Last season, Baldwin combined a strong eye with good contact skills, especially for a hitter who swings as hard as he does (75 MPH). Thus far in 2026, Baldwin’s results have been pretty close to identical while he’s on the field, with small improvements in his OBP and SLG leading to a 6-point increase in wRC+.
Baldwin’s zDV and oDV measures are interesting this year. Despite the similar results year-over-year, he’s actually showing substantial differences in his plate approach. Baldwin finished 2025 with a 106 DV, and component measures of a 105 zDV and 100 oDV. This season, Baldwin’s zDV has dropped to 99 as he’s cut his zone swing rate by about 2 points, mostly by swinging at fewer pitches on the outside third of the plate. Up-and-away was Baldwin’s main nitro zone last year, posting a .637 wOBA, 157 points higher than his second most favorable location. Baldwin has also been chasing dramatically more, for a 36.3% oSwing vs 28.8% as a rookie. He’s gone from not swinging at any waste pitches as a rookie to swinging at nearly 14% of them this year.
Baldwin has survived his increased chase because pitchers are in the zone much less often against him. He’s raised his launch angle from 6.6 degrees to 11.2 degrees, which, combined with his excellent bat speed, makes him an even bigger power threat. The extra lift has given Baldwin nearly 7 percentage points more barrels despite minimal changes in his exit velos. As a result, he’s moved up from the 82nd percentile in expected slugging percentage to the 94th percentile.
It’s not obvious that the power is sufficient for Baldwin to sustain his improvements in walk rate. No one with a better walk rate chases as much as he does. Among the top 30 qualified hitters in walk rate, only Bryce Harper is chasing more than 30% of the time. Baldwin is 71st in MLB in walk rate; among the 70 hitters who walk more than him, only Harper and Zach Neto chase a third of the time. Baldwin will still be a star even if he gives back some of his free passes – he’s a career .272 hitter with a totally normal .297 BABIP. The current iteration of Baldwin’s plate skills, however, suggests we should expect a lower OBP in the future.
Nick Kurtz: .278/.426/.533, 118 DV
We’ll conclude with the best of these players, one of the best hitters in the league. Kurtz, like the rest of the Athletics, has benefited tremendously from the weather warming up at Sutter Health Park. Kurtz is running exit velos and a barrel rate in June that are basically the same as the rest of the season. Despite the unchanging underlying metrics, Kurtz’s ISO has ticked up from .189 in April to .235 in May and now .361 in June. During June, Kurtz has a 1.300 OPS at home and a .538 OPS on the road. The road OPS is definitely underselling the A’s slugger, as he’s suffering an .063 BABIP in that time, but his ISO is nearly 300 points higher at home as well.
Kurtz’s plate approach has remained pretty consistent over the past two seasons. He’s got a discerning eye, chasing only 22% of the time, while swinging in the zone 65.5% of the time this year. Both of those numbers are marginal improvements on his debut season, but he’s swinging less overall this year. The underlying reason is the same as it was for Baldwin. Pitchers are throwing in the zone much less often as they’ve learned to fear Kurtz and his home park.
Of late, as the ball has started flying in West Sacramento, Kurtz has gotten more aggressive at the plate. He’s swinging at 72.6% of pitches in the zone in June after swinging at 62.8% of them earlier in the season. He’s done so without adding too much chase to his game, swinging only 3 percentage points more outside the zone. Even so, Kurtz’s managers should be happy every time he gives the ball a chance to fly at home. A full 45 percent of Kurtz’s fly balls have gone for homers in June, and that’s including the .538 road OPS. If you restrict your attention to just his 63 home plate appearances, a full 64% of his fly balls have left the park. Kurtz is great, with a great approach and top-tier bat speed. Do we really need to give him this park too?
Photos by David J. Griffin/Icon Sportswire and Patrick Gorski/Icon Sportswire | Designed by Aaron Asbury (@aarongifs on Instagram)
