


Major League Equivalencies
Despite the title, this article won’t walk you through the math behind pitcher MLEs, nor will it dive into full MLE tables. Still, a quick primer is useful before we move on.
Major League Equivalencies (MLEs) are a way to translate a player’s minor league performance into an estimated major league output, adjusting for the context of each player’s environment. Hitters or pitchers operating in offense-heavy leagues receive harsher adjustments, since their raw numbers would overstate how they might perform in MLB. Crucially, MLEs are not predictive models—they’re rough approximations meant to describe the type of player someone might be once they reach the highest level.
For newcomers, the biggest trap is treating MLEs like plug-and-play projections. They may look similar on the surface, but their purpose and utility are fundamentally different.
“An estimate of what a minor-league player’s seasonal statistics would be if the player had played that season for the major-league team that controls his contract. The estimate is not a projection, but a conversion of current performance. Research has shown that this estimate is as accurate as estimates of a player’s statistics for a given season based on his established performance level; it works best with Class AAA statistics. The concept was proposed by Bill James (Baseball Abstract, 1985); at the time, James considered this “by far the most important research that I have ever done.” From the Baseball Almanac (1999)
For the MLE-curious, here are the basic steps:
- Start with the player’s current minor league statistics.
-
Determine the differences in League, Level, and Park Run Environments, where one to three years is used.
-
Create a multiplier based on those differences for each category.
-
Apply the multipliers for each category to calculate the player’s MLE statistics
Voila, you have your new tables of statistics that can, may, will, could, or should help you evaluate a prospect’s ability to translate their skills to the next level.
We Know How They Throw
At this point, I’m perfectly happy to accept whatever MLE table someone hands me—mostly because I don’t find the tables themselves all that compelling. The work behind them absolutely matters and feeds into future projection systems, but I find the tables as a standalone tool less functional than scouting grades or actual game statistics.
If the goal of the MLE table is to evaluate whether a player’s skills will translate from one level to the next, why are we spending so much time focusing on outcomes? Players only control a small fraction of those. Where a batted ball lands relative to a fielder, the weather, the park dimensions, even the time of day—these all influence results in ways the player has zero agency over.
What can a player control? Their movements. Their swing and pitch types. Bat speed and pitch speed. Their position on the mound or in the batter’s box. The length of their swing or the shape of their delivery. These inputs belong entirely to the player—and the best part is, we can measure all of them. For pitchers, we know how they throw.
From the Minors to the Majors
I am nowhere near the level of statistical analysis of data technicians listed in the Further Reading section at the end of this article. What follows this paragraph is my crude way of working through the data to identify patterns or insights that could be applied to pitching analysis in 2026. Some of these understandings will likely be relevant to only a handful of players, but it is possible that there is something that can be utilized for the entire starting pitcher position. Without further ado, here is my attempt to track the progress of starting pitchers from the minor leagues to the major leagues across various pitch types.
Let’s see how they throw.
The data set includes 59 players who started at least one game in the 2025 major league season.
Four-Seamer
Four-Seamer Analysis: Shane Smith
Most debuting pitchers experienced meaningful gains in spin rate, velocity, extension, and induced vertical break on their four-seamers. Horizontal movement changes were scattered—roughly as many pitchers lost break as gained it—and slightly more pitchers threw from lower arm angles. With so many positive shifts in fastball characteristics, it raises questions about the non-player causes. Has something changed with the baseball itself or with the Hawk-Eye tracking in MLB parks, such as fewer than 12 cameras in minor league parks, perhaps? Another explanation: many rookies made their debuts in shorter, non-starter roles, allowing them to empty the tank and push their fastball traits to their upper limits.
Whatever the cause, the trend is clear: most prospect pitchers saw better fastballs when they reached the majors. A strong example is Shane Smith.
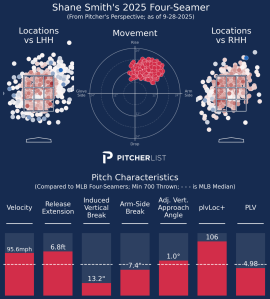
Smith threw only 117 pitches in 2024—all in relief—so we’re dealing with a small sample. Still, the changes were so dramatic that they’re worth examining. His four-seamer added nearly three inches of induced vertical break and six inches of arm-side run, while his velocity jumped to 96 mph, up roughly 1.5 ticks. He maintained the same extension but shifted to a significantly lower arm angle, which may have unlocked the new movement profile.
Smith quickly adopted the four-seamer as one of his primary putaway pitches, pairing it with his curveball and giving it the highest zone rate of any pitch in his five-pitch mix. Even with the improvements, the fastball still grades as essentially average—solid extension, but below-average movement—but the direction of change is highly encouraging.
If these traits hold over a larger sample in 2025, Smith could emerge as one of the more intriguing fastball risers among recent debut arms.
Two-Seamer
Two-Seamer Analysis: Nolan McLean
Like the four-seamer, sinkers across the league gained spin, velocity, extension, and movement in 2024–25. Many pitchers released their two-seamers from a slightly lower height, driven mostly by increased extension rather than a meaningful arm-slot change. And, echoing the cutter trends, MLB clubs generally pushed for flatter sinkers, with many pitchers showing reduced vertical break.
For the Mets’ Nolan McLean, virtually every aspect of his sinker profile—release angle, velocity, extension—stayed within just 1% of his previous baseline. The one major exception was movement: his sinker lost nearly 40% of its vertical break on average. That adjustment paid off, as his PLV grade jumped into the above-average range.
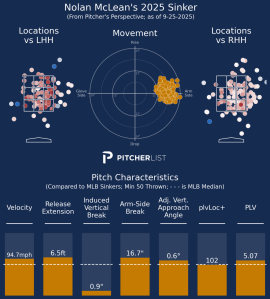
The flatter version became a pitch he could pound the zone with confidence while generating an astonishing 82% ground-ball rate. The main gap in his arsenal is a pitch that can reliably challenge hitters at the top of the zone, especially given his four-seamer’s limited induced vertical break.
Still, with a deep six-pitch mix and a standout debut already behind him, there’s plenty of excitement around whether McLean can replicate—and even build on—those results.
Splitter
Splitter Analysis: Brandon Young
There are six rookies with splitter data at Triple-A and MLB in 2024-25. The splitter was thrown on average much more frequently and with less spin, as is ideal, and at a slower rate. Someone who stood out for their improvements in measurements and usage was Baltimore’s Brandon Young.
Young’s splitter actually performed better in the majors than in Triple-A, gaining a touch of velocity, extension, and vertical depth. He generated more strikeouts, cut down on walks, and benefited from a slightly lower release angle. Importantly, his splitter’s spin rate dropped by roughly 4%, moving it into the same effective range as Yesavage’s highly regarded version of the pitch.
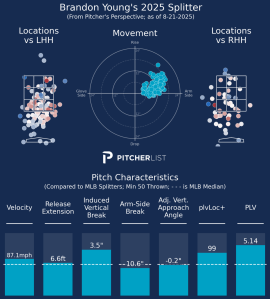
Young features a deep arsenal—six pitches, including three fastballs—and his velocity has climbed to 94 mph, improving incrementally in each of the last two seasons. The splitter graded out as his most effective pitch, with the curveball close behind. The cutter, however, clearly needs refinement.
Despite the splitter gains, Young struggled to translate those improvements into overall MLB success. While he induced a strong ground-ball rate, big-league hitters made much harder contact, and his home-run rate spiked. Both the cutter and curveball posted xwOBA marks above .530, suggesting they may require reshaping or reduced usage. Young appears aware of this—he rarely turned to them when behind in the count.
The good news: his walk rate remained manageable, giving him a viable pathway to better results in 2026 if he sharpens the secondaries. For now, he projects to open the year with Triple-A Norfolk, making him a pitcher worth monitoring closely. In deep draft-and-hold formats, he’s a legitimate late-round consideration.
Cutter
Cutter Analysis: Ian Seymour
As with several other pitch types, most debuting pitchers saw notable increases in spin rate, velocity, and extension on their cutters. Unlike the trends seen with fastballs and sinkers, however, a larger share of pitchers actually raised their release points—likely the result of more cutters being thrown from higher arm slots. Changes in movement were more evenly distributed, but the overarching pattern suggests teams are encouraging pitchers to throw flatter, firmer cutters at the MLB level.
This makes sense: hitters have adjusted quickly to big sweeper-style breakers and have become adept at anticipating when those pitches appear in certain counts. A harder slider/cutter hybrid with a tighter, shorter break is increasingly viewed as the more deceptive option.
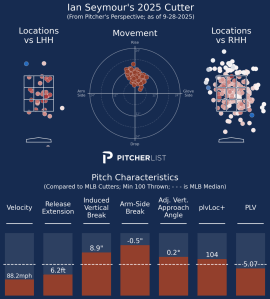
A strong example is Ian Seymour, who added roughly two mph to his cutter—an important development given that he typically operates below 92 mph overall. Despite that modest velocity band, Seymour consistently generated whiffs, and the data hints at an arsenal that could benefit from further “collapse”—bringing his pitch shapes and release points closer together to enhance deception.
His cutter performed well as an early-count strike and produced enough ground balls to be a reliable weapon against right-handed hitters. The main mechanical gap is that he releases the cutter from a noticeably different arm slot than his four-seamer, an area that could improve with refinement. Overall, Seymour’s five-pitch mix gives him multiple pathways to success, even without premium velocity.
Slider
Slider Analysis: Chad Patrick
The slider showed many of the same league-wide trends seen across other pitch types: higher velocity, increased spin, longer extension, and slightly lower release heights. Movement changes were more mixed overall. A good example of this pattern is Chad Patrick, whose slider profile in the majors closely resembled what he threw in the minors.
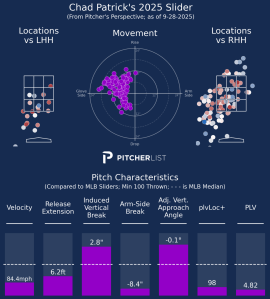
Patrick did add more extension, along with a few extra inches of both vertical drop and horizontal sweep. Interestingly, he delivered the pitch from a higher arm angle while maintaining the same vertical release point—likely because of that added extension. While the slider isn’t his primary weapon, it produced a stronger whiff rate in Triple-A and carried a more favorable PLV grade there. In the majors, he appears to lean on it as a putaway option vs. righties.
Given that Patrick featured four pitches with a Stuff+ of 108 or better in 2025, he’s an intriguing arm to track heading into 2026—especially with a realistic path to 145+ MLB innings.
Curveball
Curveball Analysis: Hunter Dobbins
Breaking-ball pitchers followed many of the same league-wide trends: more spin, more velocity, longer extension, and lower release heights—despite simultaneously showing higher arm angles, a quirk largely explained by the added extension. These pitchers also tended to generate more horizontal movement. While some arms, like Thomas Harrington, saw dramatic jumps in break (he nearly doubled his curveball sweep), Hunter Dobbins provides a case study with a 35% increase in curveball break. Interestingly, while stuff models still prefer his slider, Dobbins made no major mechanical changes after his promotion.
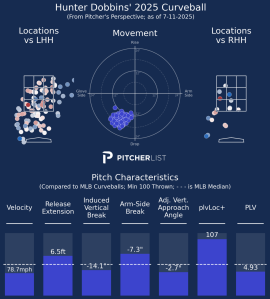
What changed was the effectiveness. Dobbins transformed his curveball from a serviceable pitch into a 38% whiff-rate weapon. His arm angle ticked up, yet his release point stayed low thanks to a 3.4% boost in extension. He also added a bit of spin and velocity, helping the pitch play up even more. The curveball quickly became his best putaway option, slightly edging out his slider, and he trusted it enough to make it his most-used pitch with two strikes.
With a foundation built on three above-average pitches, it’ll be exciting to see what the St. Louis pitching lab can unlock with Dobbins heading into 2026.
Changeup
Changeup Analysis: Brad Lord
Changeup-focused pitchers generally added velocity, movement, and extension, though not always spin. Many also began throwing the pitch from a higher arm angle, contributing to the added movement profile.
Brad Lord exemplifies this trend. He increased his changeup velocity and boosted its spin by 11%, which helped drive the pitch’s horizontal break up to 19 inches. Even with these improvements, the changeup isn’t his defining weapon—but it now functions more effectively as a supporting pitch alongside his superior gyro slider and curveball. He trusts it enough to use it frequently in two-strike counts, even though he can struggle to land it in the zone.
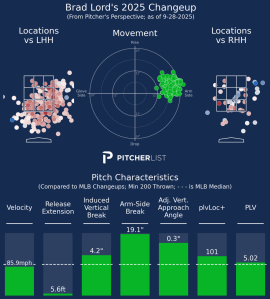
One concern: Lord gets little extension on any of his pitches, which is often a red flag in terms of deception and perceived velocity. He won’t anchor a fantasy roster in strikeouts, but he does produce a high volume of ground balls, which helps him work deeper into games. If he can fine-tune his pitch mix to bring his home-run rate back to league average, he has a realistic path to returning to the 3.50 xFIP range.
Conclusion
I openly welcome commentary (constructive feedback, as it were) about this study, as it would only serve to make me a better fantasy baseball analyst. Please send any commentary to @YGMfantasy under the article heading or hit me up in the Pitcher List Discord.
In the analysis above, I examined how a starter’s pitch shapes changed during the transition from Triple-A to the major leagues. I didn’t go in with a strong prediction about the results, but I certainly didn’t expect prospects to show improved stuff after being promoted. Yet the data suggests that many minor league pitchers actually experienced meaningful upgrades in their pitch characteristics from 2024 to 2025.
What’s far less clear is why these improvements occurred or which specific traits are most likely to translate into better on-field outcomes. And even when the pitch data moved in a “positive” direction, that didn’t guarantee better performance. This pitch-by-pitch comparison raises the next logical set of questions:
-
Which pitchers translated their changes into more ground balls, strikeouts, or whiffs?
-
Were there shared traits among those who did?
-
And most importantly, could any of this improvement have been predicted from their Minor League metrics?
- And how will these pitch characteristics hold up in year two?
Analyzing individual pitches in isolation is, admittedly, a debatable exercise. Yet here we are dissecting arsenals, trying to understand how pitchers threw the ball differently rather than focusing purely on results. That approach feels valuable—perhaps even necessary—if we want to appreciate how the craft of pitching is evolving.
Application
Let’s put these questions into practice by looking at a few prospects who are likely to debut in 2026.
Changeup Analysis: Thomas White
Thomas White is a principal name to watch. The results already point to a pitcher on the rise, and as a left-hander, his upside in the majors is even more intriguing. To reach that ceiling, though, he’ll need to consistently neutralize right-handed hitters—which makes the development of his changeup especially important.
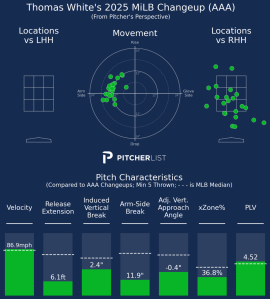
That changeup has the traits of a legitimate out pitch. It averages 87 mph with a remarkably low 1,000 RPM spin rate and about 12 inches of movement. PLV currently grades it as average, but the underlying characteristics suggest there’s more in the tank. While his 6.1 feet of extension is slightly below average, he compensates with a low arm angle that creates deception and releases the ball well away from his body. It’s already his most effective pitch in terms of limiting contact and generating whiffs. If he can sharpen it further—while tightening command of the four-seamer—the entire arsenal could take a step forward.
The fastball is the next frontier. A modest velocity bump, a bit more induced vertical break, or improved extension—similar to the gains we saw from several 2025 debuts—could elevate his profile across the board. Even without touching 97 mph, simply reducing some horizontal movement to improve command and predictability might unlock better results. The encouraging part? White already owns three pitches with whiff rates north of 35%. With either enhanced stuff or improved command, he has the ingredients to make a substantial leap.
Four Seamer Analysis: Andrew Painter
Another arm who could take a significant step forward with the right adjustments is Andrew Painter. Beyond sharpening his approach against left-handed hitters, much of his developmental focus is likely on refining his fastball. It sounds strange to question a pitch that averages 97 mph, but the results tell the story: it allowed the highest wOBA in his arsenal, generated the lowest whiff rate, and Pitch Level Value (PLV) graded it as the weakest offering in his five-pitch mix.
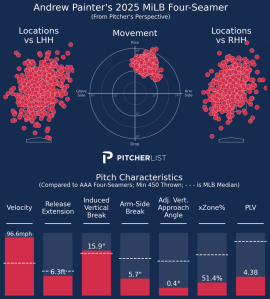
The raw ingredients are there. Painter releases the ball from roughly a 43-degree arm angle and gets more than 6.3 feet of extension. If he can lower that arm slot slightly or tweak the shape to add a bit more induced vertical break, the pitch could play closer to average—or better. Even a modest improvement in life or deception could change the profile of a fastball that produced just a 14% strikeout rate against a 12% walk rate across 902 throws. For a pitch with that kind of velocity, there’s untapped upside.
We expect growth from elite prospects because they dedicate themselves to constant refinement. The hope is that a promotion—and the challenge that comes with it—forces that next leap. That’s why it’s worth targeting arms like Painter (and others in a similar mold): if one or two small tweaks click, they can quickly transform from intriguing talents into impact major-league starters—and valuable fantasy assets.
Sinker Analysis: JR Ritchie
I’ve long viewed the Braves as an organization unafraid to push their prospects aggressively, and this year may force their hand. With Spencer Schwellenbach sidelined for most of the season, Atlanta could accelerate its timeline. One of their top pitching prospects, JR Ritchie, earned a promotion to Triple-A Gwinnett on July 19 and nearly reached 60 innings at the level. That’s already more Triple-A experience than several current Braves starters had before debuting, making a strong case that Ritchie is close to major-league ready.
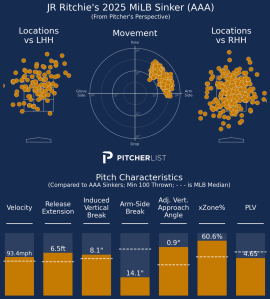
Still, there’s room for refinement—particularly with his most-used pitch, the sinker. The two-seamer averages 93 mph with roughly a 2200 RPM spin rate and a solid 6.5 feet of extension. It generates an impressive 14 inches of horizontal movement but only about 9 inches of vertical break. Given his already low arm slot, there may not be much room to chase additional vertical movement by dropping lower. Interestingly, his pitch movement chart shows two distinct clusters, suggesting he may have already made a meaningful tweak to the offering.
Even so, the sinker remains his least effective pitch despite being his primary one. If it’s going to anchor his approach as a groundball weapon, it has to take a step forward. He may not be able to squeeze out more movement, but a slight velocity bump could give it sharper depth and improve its effectiveness against major-league hitters. If he can turn that pitch from a liability into a dependable foundation, the leap to Atlanta becomes much more realistic.
Slider Analysis: Rhett Lowder
Rhett Lowder was something of a blind spot for me after multiple injuries pushed him off the radar in 2025. But his healthy finish to the season changes the outlook. With sustained health now in place, it’s reasonable to envision a 2026 return to the major-league roster. The 6’2″ right-hander works from a low three-quarters slot with modest extension, and he’s already made a smart adjustment since 2024—leaning far more heavily on his devastating sinker than on the four-seamer. Here, though, the focus is on his most-used breaking ball: the slider.
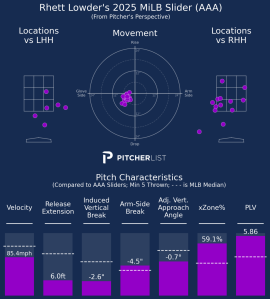
One broad adjustment that could elevate his entire arsenal is adding a bit more extension. Lowder’s delivery is smooth and whippy—long through the arm path but finishing with a graceful flick—which likely contributes to the heavy movement on his sinker. With the slider, he’s chasing a true gyro shape, spinning it past 2,800 rpm at times. Encouragingly, he made a notable stride with the pitch in the Arizona Fall League, tightening the shape and bringing it closer to true center on the movement chart compared to where it was landing in 2024 at the Major League level and in 2025 at Triple-A.
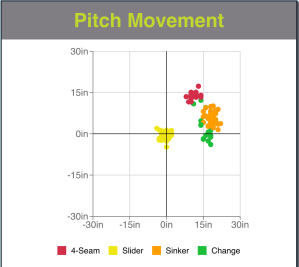
Rhett Lowder AFL Pitch Movement Chart
For evaluators to fully buy into his rebound, he’ll need to repeat those mechanics and pitch characteristics over the first few months of the new season while rebuilding stamina. Before the injuries, Lowder’s reputation was built on strikeouts and command. Now that he’s on the doorstep of a second major-league stint, that pedigree should carry more weight than the lost time.
Curveball Analysis: George Klassen
George Klassen made just one Triple-A start in 2025, though that number likely would have been higher if not for a concussion suffered after he was struck in the head during his May 11 outing. The 6’2″ right-hander still finished strong, recording 40 strikeouts against 12 walks over his final five appearances (29 innings). With a possible MLB debut on the horizon in 2026, his next step is firming up a reliable third pitch to complement his slider and four-seam fastball.
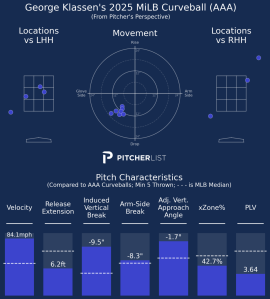
Right now, his primary breaking ball—a firm, glove-side curve—arrives around 84 mph with nearly 2,500 rpm of spin. It’s his main weapon for attacking hitters on that side of the plate with depth and lateral movement. While there may be some room to optimize spin efficiency, a more practical path could be pairing the curve with a cutter to give hitters a different look in the same tunnel. Notably, the curve also comes from the highest release point in his arsenal, suggesting that subtle adjustments to extension or arm angle might unlock a new shape for both the pitch and his overall mix.
Encouragingly, Klassen has made significant strides in command. With that foundation in place, even incremental refinements to pitch design and sequencing could meaningfully elevate his results as he closes in on the majors.
Resources
The source spreadsheet showing the Statcast data for Debut Pitchers
Baseball Reference List of 2025 Debuts
Pitcher List PLV MiLB Pitchtype cards $$$ PL Pro
Further Reading on Major League Equivalencies & Related Topics:
Baseball HQ MLE table $$$ (2025)
This report describes how rising prospects need to adjust to the new baseball once they reach Triple-A. (2025)
MLE Pitching Method (2021)
Here is an important correlation analysis from the minors to the bigs (2019)
Dynasty Guru’s calculator (2019)
Statcorner Park Report (2019)
Here is an attempt to translate scouting grades into pitch info (2016)
This Hardball Times article describes how pitchers aren’t changing. (2014)
Adjusting Minor League Rates (2011)
Justin Inaz’s Minor League run environments (2010)
FanGraphs explainer (2010)
Smarter Projections (2010)
Baseball Prospectus step-by-step guide (2009)
Issues with MLE (?)
MLE validation study (1998)
Dan Szymborski’s step-by-step MLE guide for hitters (1997)
Photos by Frank Jansky/Icon Sportswire | Featured Image by Justin Redler (@reldernitsuj on Bsky/Twitter)
