Over the years, dynasty “truths” have been established: “a prep player is riskier”, for example. These truths have lived in the world of general speak and guts for me. Colin Charles helped me get after some massive data to perhaps give our guts a better crystal ball.
2020 paused the commencement of an entire MLB draft class’ pro careers, minus Garrett Crochet, and got us down the road enough whereupon historical NFBC ADP data may provide decent sample sizes of things. Players like Joe Mauer have played out their careers leaving their complete fantasy history for us. Colin and I married NFBC ADP histories to MLB Draft histories and scratched some surfaces.
The Process
NFBC draft data goes back to 2004, but the first few years were a small sample of leagues, so we started at 2006, ending in 2020, and pulled out MLB Draft data from 2000-2015 (players that did not sign after draft omitted). There are some stories yet to be finished from the latter portion of our sample, players like Blake Snell, Jack Flaherty, Kyle Tucker.
Nonetheless, they have given us some ADP history and we are not hunting uber precise numbers here, more a general sense of things important as to how they relate to each other, for example, how we may correctly prioritize college hitter vs college pitcher vs prep hitter vs prep pitcher. Or hitter taken in the 3rd round of the MLB draft vs pitcher taken in the 1st round.
The methods to some conclusions are gray, yet still more specific than guts and speak. We are prospecting after all, which comes with more failure than success, and very few guarantees. A players ADP height may not speak to the actuality of fantasy success, more the perceived value of an asset or some guesses at when a player was going to produce a “planned” way. And even though we have started laying the foundation to get into the sustainability of fantasy success, we do not delve into that here.
Making the Bigs

So the “truth” that prep players are riskier in the sense of simply becoming MLBers is reinforced. Prep players are riskier, but teams must be taking these risks because of a different kind of rate of success in terms of becoming strong MLB assets, right? We can’t speak for them, but we can look at that in terms of fantasy reward. My preconception was the risk was worth taking with them because they offered chances at a big reward differently than college prospects. As we will start to see, there may not be any historical evidence of that, or at least we can think about that risk better.
How long does it take?
Here is a look at the top 100 draft slots’ average time from draft to debut, broken down in slightly more specific demographics of player:
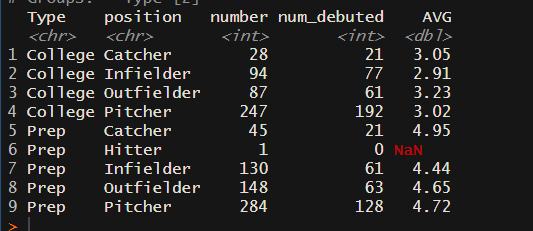
Given MLB Draft rules, I’m just going to “common knowledge” guess here; the average age difference between a prep draftee and college draftee is 3(+) years. Prep players generally take 1.5-2 years longer from draft to debut, so even though you have to wait on them longer, they tend to reach the bigs about a year and a half younger than college players.
We also went a step further and supplied the average time from draft to peak NFBC ADP. I’m not totally sure what to think of this data. A player with a long career is the only one capable of reaching 12 years out. The majority of players only have a window of a few years. That data remains an FYI component this go-’round.
NFBC ADP History
Simply making the big leagues doesn’t do much for a fantasy owner though. We want to know how they produce for our teams. Here is a generalized look at that: (We are going to get much more specific.)

For better or worse, we are using draft ranges/positions drafted as/prep vs college to further categorize prospects. We were unable to differentiate between LHP and RHP at this time. It may be unfair to keep them in the same category here, so judge accordingly. Common knowledge is lefties should have a better shot than righties, but some question on that will come up later. We pushed our sample sizes to the limit to get as specific as possible. Here is a link to all the demographics we created and looked into for your reference:
2000-2015 MLB Draft history demographics and their NFBC ADP heights (link).
The 2020 MLB Draft and “Slots”
The MLB draft is an imperfect tool to assess the desirability of a player from organizations. It is not a straightforward top to bottom list like other sports. Signing amounts aren’t linear, games are played by organizations, prospects leaning towards college selected and signed for earlier round money, it’s a wrinkle in this in research.
As a possible workaround, we began diving into using signing amounts as an indicator of a player’s desirability, but also found it to have issues; leaning in a questionable way toward prep players organizations wanted to sign away from school. The link earlier has nothing concerning signing amounts baked in. The list we are going to share with you next does.
Judgment calls and best guesses were required to slot players into their best suited historical profile. A large majority of those decisions were quite easy and obvious. Others, like Tyler Soderstrom, proved more difficult. We even customized some to better fit a player, melding multiple demographics together, Austin Wells for example.
Note: Some players have demographics containing lies. Cole Wilcox is labeled college pitcher picks 11-20 despite being drafted in the 80th slot. His 17th highest signing amount, 3.3M, correlates to this seemingly “mislabeled” demographic. These “lies” are highlighted yellow. From here on out, we will translate “Top 10” to “super-elite”, “Top 25” to “elite”, “Top 50” to “12-team stud”, “Top 100” to “12-team core player”, “Top 200” to “average 12-team player”, Top 300 to “12-team relevant”, “Top 400” to “15-team relevant”, “Top 500” to “20-team relevant”, “Outside Top 500” to “30-team relevant”, and “Undrafted” to “bust”.
Here is a list assigning all 160 2020 MLB draftees to a translated historical demographic which used signing amounts instead of draft slots as an indicator of desirability:
The 2020 MLB Draft’s assigned historical demographics (link).
The #1 Draft pick vs #1 Prospect
The #1 MLB picks and “Top 5” prospects from 2000-2015 (link)
We got curious about prospect lists and delved into wanting to know similar fantasy success rate history. We took the five players yet to repeat on the top of lists starting in 2000, ending in 2015, ending with 95 of them (5 x 16), and put them up against the top five draft picks (who signed after the draft and made the bigs) from the same year’s MLB drafts (79 of them):

Albeit a small sample size this narrowed, #1 draft picks achieved super-elite ADP more often than #1 prospects. Top prospects did much better reaching fantasy tiers post top 50/12-team stud. When you further breakdown to just hitters taken #1, they account for 4 of the 5 super-elites (Gerrit Cole was the lone pitcher). Not surprisingly, Spencer Torkelson’s demographic is on top of our look through the 2020 draft:
History’s “Elite’s” ( >10%)

These player’s historical counterparts proved to be the best chances at a top 25 fantasy asset, the only demographics who hit this height greater than 10% of the time. Tork and Nick Gonzales didn’t have a lot of history here, but I feel good 10%+ is more than a fair assessment. All but Justin Foscue’s historical counterparts reached average 12-team player heights greater than 50% of the time. Not surprisingly, the bust rates were significantly higher for the preps, more than twice as high. My early dynasty playing self, when the MLB draft slot overly affected my decisions, would have benefited from seeing this.
As much as we would love to give you a nice 1-160 rundown here, there is no way to quantify, at least to my limited knowledge, the quality of the aggregated probabilities for these individual players, considering the different fantasy tiers, against each other. That feat is left for “top” lists and the comparing of apples to oranges required by the brave authors. This is not a rank, rather some information to help formulate them or your FYPD priorities.
12-Team Studs ( >10%) With Problems

Moving down to history’s best remaining shots at top 50 assets, we still see some chances at more, but we also see some bust rates jumping up significantly. Heston Kjerstad and Zac Veen don’t have much history to go off of here, but both players reaching elite levels would be unprecedented. A current top prospect, Jarred Kelenic, might beat them to the punch though if all goes well. Blaze Jordan was the only player whose position drafted as was altered, as we felt a power-driven profile like his was better reflected as a 1B for these purposes. More of that sort of thing could be done with some players, but that will be for you to decide.
The prep hitters here haven’t yielded elite fantasy assets at a higher rate than their list mates, only more failure in regards to shooting for the big fantasy star. The two big bust rates here are power-driven profiles. That will not be the last we see of that.
Small-Name College IFs > Mid-1st Rd Prep Arms?
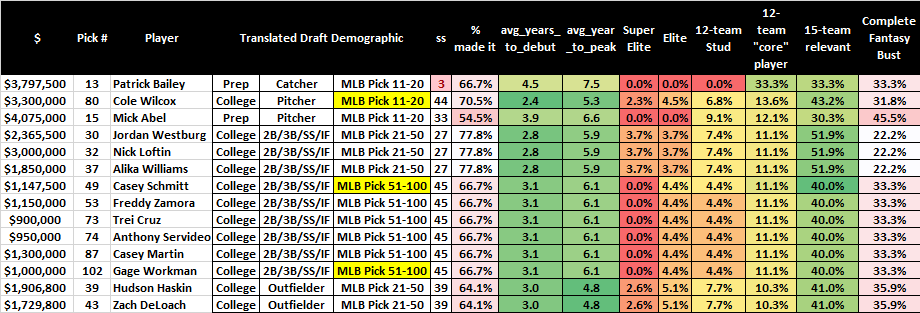
The 2020 Draft was loaded with highly thought of prep Cs. There isn’t enough history of them getting drafted as highly to take much away here. Patrick Bailey is a slick defensive prospect with a bright future ahead, and luckily for us, one we don’t need to waste too much energy on prognosticating its fantasy implications.
There is some historically based evidence here a highly touted middle of the 1st Rd prep arm, especially a right-handed one, isn’t much, or any better than a 2nd-3rd RD college IF and definitely hasn’t been a better investment than a late 1st to mid-2nd Rd one. Organizations are getting wiser with their prep arm evaluation though, right? Will this look different in ten years? I’ll hunt for these potentially under-appreciated chances at fantasy success in the meantime if a profile I like shows itself. We’ll get to more of that later as well.
Vanilla Beans

Aaron Sabato’s slot history was so small we expanded it to try and get a better idea. It still left much to be desired, in both sample size and ADP history results. Bake in his slugger profile and I’m not liking one of my favorite college player’s fantasy appeal as much. History has provided a relatively safe floor fantasy asset in late 1st to mid 2nd Rds of drafts/corresponding signing amount, without much else to get excited about. This history is more exciting to the large league owner.
Last Decent Shots

College OFs drafted in this range provided us with the last chance at a better than a coin-flip’s chance at a fantasy asset. This might be the breeding ground of 4th OF types with a chance to be more.
Lightning In A Bottle

The last of our histories to have produced top 10 fantasy assets are these prep bats drafted 21-160. This territory had varying degrees of the “high risk/high reward” prospect. David Wright, Trevor Story, Charlie Blackmon, Giancarlo Stanton, Grady Sizemore, Nolan Arenado, and Cody Bellinger account for the super elites here. That’s 7 out of 345.
My Prep Pitcher Problem
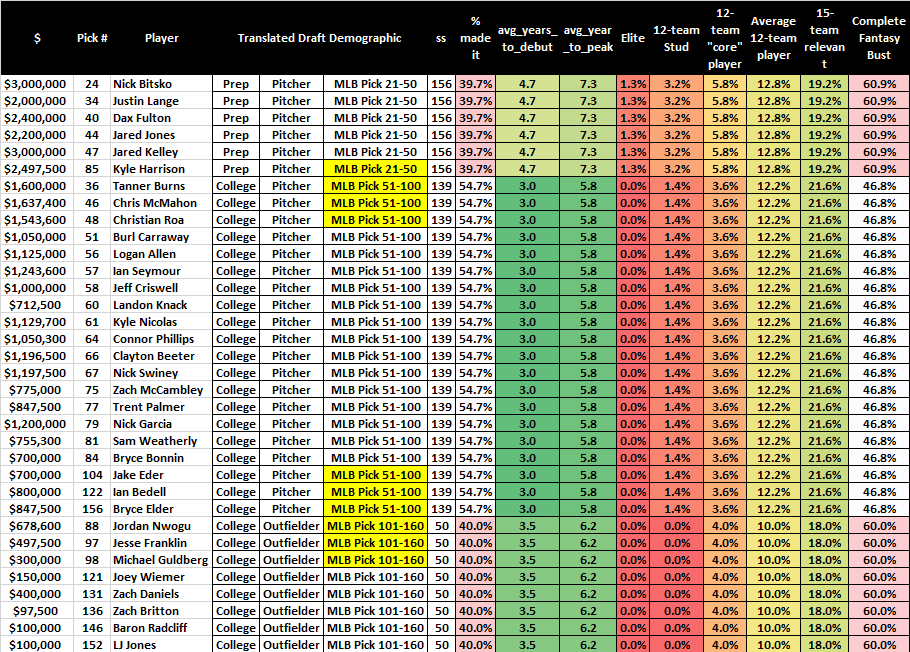
Some prep pitchers drafted early, some college pitchers drafted later, and the last of our college OFs have given us the last 10% or better chance at a top 200 asset. A prep pitcher drafted 21-50 has twice reached top 25 heights out of 156 of them, Noah Syndergaard and Jack Flaherty. Those are two RHPs though. The prep pitcher problem appears even harder to wrap my head around, well easier really.
I blame Clayton Kershaw, who was the penultimate dynasty success story; drafted early, sustained perceived value as a prospect, reached super-elite fantasy heights, and stayed there for a while. Madison Bumgarner, who was drafted the following year, was the next best fantasy success story. Then it seems MLB organizations took notice and the early prep pitcher boom was on, and dynasty owners followed suit.
All prep pitchers selected since Kershaw, Top 100 MLB Draft Slots (link).
Organizations seem to have learned, so we have to account for that, but I wonder what happens if Hunter Greene and Ian Anderson’s fantasy careers take off? Will organizations take dynasty owners down this road again?
The Flaherty’s and Snell’s may be bucking the trend, but there is a large gap in the cost/benefit compared to other options going for the same dynasty price, with alternatives later not depriving you of upside and often less likely to completely bust. The Nick Bitsko’s of the past haven’t yielded us much better results than the Ian Bedell’s of the past justifying the price difference. If the recent trend continues, adjust some, of course, but what’s the need to be first in that race when you can do the following?:
Bitsko vs Bedell+Beeter
Let’s say I have a 12-team FYPD coming and I want to allocate 1-2 of my picks to landing a decent pitching prospect. I’m thinking about Bitsko. There is some solid evidence waiting until your last two picks, to take two much less thought of college pitchers, is a better idea:

Account for the current trend upward for prep pitchers if you want to, and boost Bitsko’s “odds” here. I’m still liking my chances with the slick bat I took early, instead of Bitsko, and taking the two pitchers no one wanted at the end. Nevermind this is probably a grossly underestimated quality of college pitching prospect you could land with your last two picks in a 12-team FYPD, but I’m far from sold on the current cost of these contemporary prep pitching prospects in FYPDs.
(We will have a little probability 101 session shortly if you need to catch how those numbers came to be.)
Catchers

Yeah, we need those. Jesting aside, there are some names here history hasn’t given us much insight into. Wells is a hard one to peg, but we have seen the slugger-types history if that is what he is. I happen to think Drew Romo has more fantasy appeal than history suggests. It’s peculiar college catchers drafted 101-160 have been slightly better fantasy players than college catchers drafted 21-50. The sample size is very small though. Does this suggest Dillon Dingler types are owed some positive regression from history? Way too much catcher think. Onward and upward into the mud.
The Mud
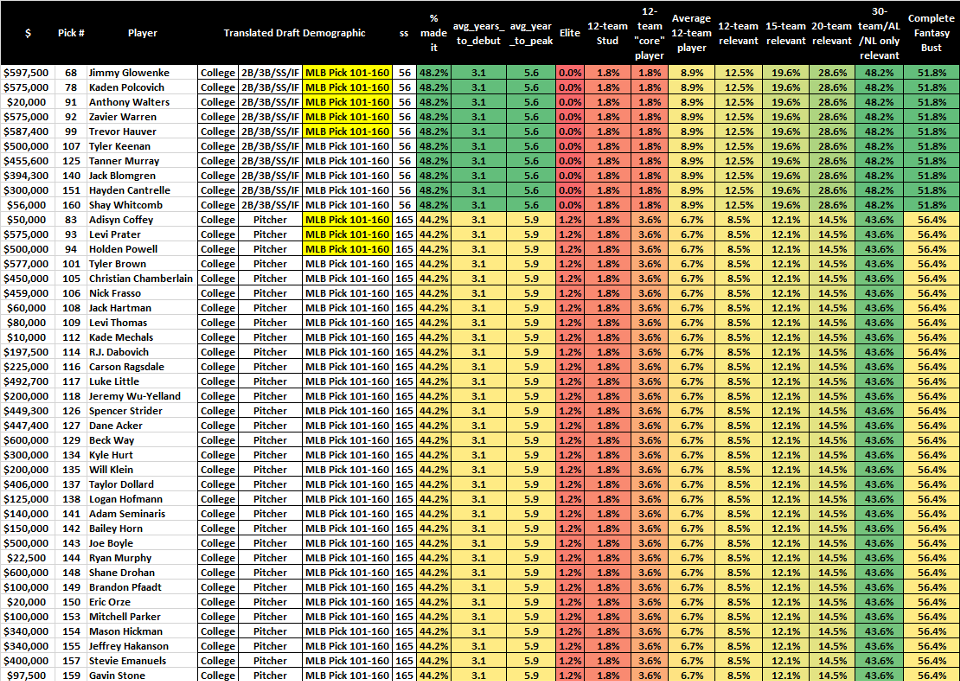
The last of history’s college demographics is only a paradise for the deep leaguer who loves digging through the mud, coming up with the gorgeously ugly pieces needed. There has been, relatively speaking, very nice safety here for such an endeavor.
Yikes

Some very high-risk preps leave us the last glimpse at history. Busts rates 82%+. Ben Hernandez’s profile makes me want to think he could buck the trend here, but results like this aren’t inspiring to make it any sort of priority, leaving me the sense prep pitchers post 50 slot money aren’t worth much thought in fantasy. The MLB draft is shortening as well, so the last round may start to be much harder to take history lessons from, as organizations approach it differently, perhaps.
Images aren’t fun to play with: The Histories of the 2020 MLB Draftee’s slot (link).
The Good Stuff IMO
It’s easy to get excited about your FYPD draft selections, but that is where a lot of the disconnect exists. Much like musical chairs, we plant more flags than there are chairs, but there isn’t just one less chair, there are 10, 12, 15, 20 fewer depending on the size of your league or expectations of your owners. In the context above, I calculated there may be about a 92% chance there is a top 10 fantasy asset coming from the 2020 draft. The human behavior of it acts like 10 or more are in there. Take what we will from looking at historical counterparts, but this data may be more useful in the context of trades and how we could better assess the value of a prospect.
Eric Cross of Fantrax posted an interesting poll on Twitter and was kind enough to let me share it here. It shed some interesting light on the disconnect between true and perceived value I’m speaking of:
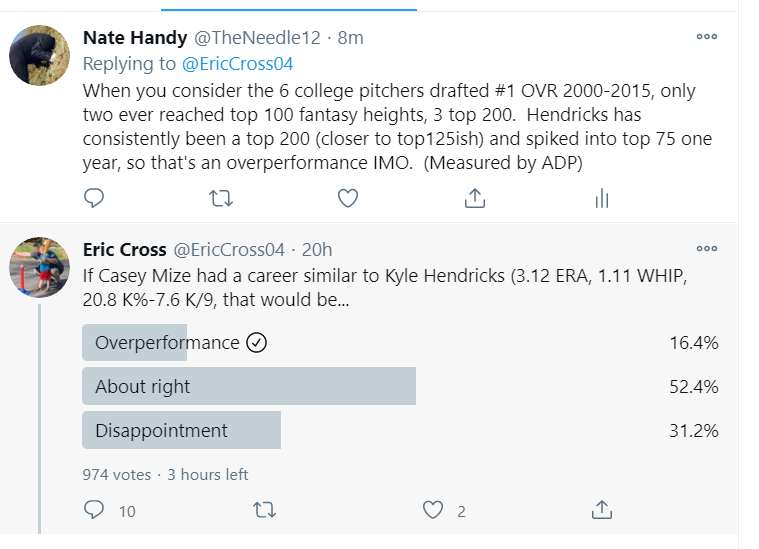
In addition to historical evidence I shared in the tweet, add the sustained fantasy success Kyle Hendricks has had, and the argument he could very well have been an under-drafted fantasy asset for some time, Casey Mize becoming a fantasy version of him could be considered a giant win for a dynasty owner, yet only 16.4% of 974 voters felt that would be an overperformance.
The term “rebuild” has become a dirty word for me and this is why. If the large majority of owners are perceiving the value of prospects in a manner reflected in the poll, they could very well not be building anything, but rather destroying. So if nothing else, perhaps the exercise we did earlier could help us do that while drafting and trading prospects.
Let’s say we just inherited a dynasty team full of trash and Ronald Acuna. I’m gonna do the “rebuild” thing. What kind of prospect package should I ask for? My caveat is I want to feel about 85% sure I’m going to at least get a top 10 fantasy asset back at some point, and lots of extra juice.
Probability 101
This may be oversimplified, but we don’t need complex stuff here.
Theoretical trade of Acuna for Tork, Gonzales, Veen, Martin, and Foscue. We will pull the numbers from the exercise above to use here, but I’m gonna personalize Veen’s and give him a 4% bump cause I “like” him.
| Super Elite | Not Super Elite | |
| Spencer Torkelson | 50.0% | 50.0% |
| Austin Martin | 23.5% | 76.5% |
| Nick Gonzales | 14.3% | 85.7% |
| Justin Foscue | 8.3% | 91.7% |
| Zac Veen | 4.0% | 96.0% |
| 91.7% | 408.3% |
It is incorrect to add up percentages and think those are your real odds. You cannot simultaneously have a 91.7% chance something will happen and a 408.3% chance it doesn’t. The correct way to determine is:
1 – ( .5 x .765 x .857 x .917 x .96) = .6831 = 68.31%
The Legend of the Untradeable Player
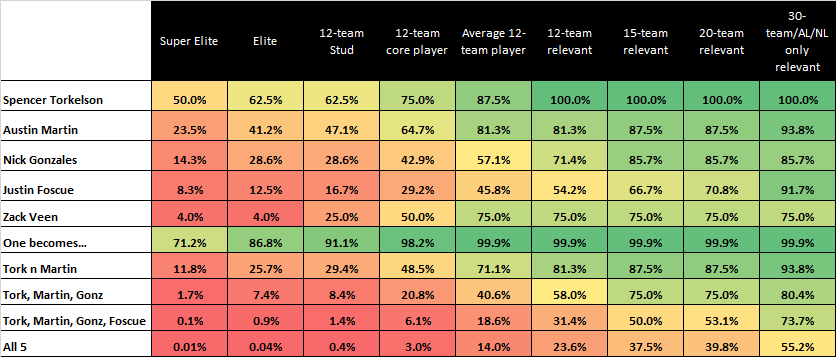
The dynasty players I polled on this fictional Acuna trade did not make the same error I did thinking I had a 91.7% chance at getting a super-elite player back. They overwhelmingly, and correctly did not want this trade under this premise. But hey, theoretically we are getting five players back, what if I have a 68% chance at one hitting super-elite, but a 30% chance at two hitting 12-team stud? Then it may be worth it. To figure that out, you have to multiply the likelihood of things happening together, so .5 x .235 would give you the likelihood of both “Tork” and “Martin” becoming “super-elite”. Here are your chances of multiple players with these odds hitting: (There are more permutations of outcomes than I will show you, but I will give you the ones most in your favor.)
| Chances one becomes “super-elite” | 71.2% |
| Chances Torkelson and Martin become “super-elite” | 11.8% |
| Tork, Martin, and Gonzales… | 1.7% |
| Tork, Martin, Gonzales, and Foscue | 0.1% |
| All 5… | 0.001% |
Now, this is a simplistic evaluation of said trade, but if you wanted to feel really good about getting that super-elite asset back, this kind of trade would not cut it. If you are comfortable getting favorable shots at say 3 top 100 assets, it may be a different story.
Better Trades
Whether or not things look good to you in our 5 prospect package is far too subjectable a discussion for right now, but something like a 71.1% chance at getting two average players for one top 3 asset doesn’t get me too excited in a 12 team league. And we aren’t talking any sort of trade involving established fantasy assets here. Acuna for some big leaguers and some prospects is a different story, one I saw play out in one of my 30-team leagues (WGM) and went well for both owners. (Justin Walker, the receiver of Acuna did win the league, however.) So what about a package including prospects we concluded have better chances than the guys above? Here is a table to help gauge that:
| 10.00% | 25% | 33% | 50% | 60% | 70% | 80% | 90% | 95% | 99% | |
| One of the five will… | 41.0% | 76.3% | 86.5% | 96.9% | 99.0% | 99.8% | 99.97% | 99.99% | 99.99% | 99.99% |
| two of the five will… | 4.1% | 19.1% | 28.5% | 48.4% | 59.4% | 69.8% | 80.0% | 90.0% | 95.0% | 99.0% |
| three of the five will… | 0.4% | 4.8% | 9.4% | 24.2% | 35.6% | 48.9% | 64.0% | 81.0% | 90.2% | 98.0% |
| four of the five will… | 0.04% | 1.2% | 3.1% | 12.1% | 21.4% | 34.2% | 51.2% | 72.9% | 85.7% | 97.0% |
| all five will… | 0.004% | 0.3% | 1.0% | 6.1% | 12.8% | 24.0% | 40.9% | 65.6% | 81.5% | 96.1% |
The columns assume all five players have the same determined chances. So if you had five players all with a 50% chance at becoming (insert whatever), you’d have a 96.9% chance one will “hit”, 48.4% two will “hit”, 24.2% at three, 12.1% chance at four, and 6.1% chance at all five. Now we are talking, right? The problem is, in the context of this Acuna trade we set up, where are we going to find that many prospects with 50% chances at becoming super-elite?
A #1 MLB draft choice hitter is the best we’ve found at a wobbly 50%, and we can’t multiply Torkelson. Maybe we could find Tork, Adley Rutschman, Royce Lewis, and some other top prospects on the same roster and go for that, but it still won’t be enough to meet our fictional requisite. Remember from our table earlier, the #1 prospect reached super-elite heights under 19% of the time so a set of 5 prospects with 50% chances feels like fantasy la la land.
Yet we still see so many trades in dynasty leagues whereupon an established fantasy asset gets shipped off for a few mid-tier prospects who appear to have unfavorable odds of returning the value of asset shipped. And I am not immune.
Fatal Attraction
I shipped off Aaron Civale and the 25th pick in an FYPD for the 5th pick in the FYPD. I felt I was overpaying, but also felt ok about being aggressive to get a prospect I really liked. This is a 30-team pts league, and Civale was the 90th highest scoring player in the league 2020. I’m gonna go ahead and say the 25th pick I sent is equal to the college pitcher selected 11-20 demographic we looked at earlier. Let’s see how it shakes out.
| Super Elite | Elite | 12-team Stud | 12-team core player | Average 12-team player | 12-team relevant | 15-team relevant | 20-team relevant | 30-team/AL/NL only relevant | Bust | |
| Gave: | ||||||||||
| Aaron Civale | 0% | 0% | 0% | 100% | 100% | 100% | 100% | 100% | 100% | 0% |
| 11-20 college P | 2.3% | 4.5% | 6.8% | 13.6% | 20.5% | 29.5% | 43.2% | 50.0% | 68.2% | 31.8% |
| Got: | ||||||||||
| Target’s draft demographic | 0.0% | 7.7% | 15.4% | 23.1% | 30.8% | 46.2% | 61.5% | 61.5% | 84.6% | 15.4% |
| Target turns into Top 5 prospect | 11.6% | 21.1% | 34.7% | 64.2% | 87.4% | 91.6% | 94.7% | 98.9% | 1.1% |
At the time I made the trade, Garrett Mitchell was the player I was aggressively seeking. I also included the top 5 prospect chances here, because surely my target will turn into that, right? If he doesn’t, I fear I made too risky a choice. In terms of just being relevant in the 30-team league, I gave up an already very relevant player and a 68% shot at another one for an 85% shot at one. I gave up a top 100 type player to increase my odds of hitting a super-elite asset by only 3.2% while simultaneously only giving myself, at best, a 64% chance at getting the asset I gave up back. Transactions in dynasty leagues like this happen all the time. I gave Mitchell a very unjustified probability boost because I’m confident in him, but I’m not going to hit on these kinds of confidences often. Playing with fire.
The Box Score
Hopefully, Colin and I just started scratching the surface of what we can take away with some of our newfound data. I could go on endlessly about different trades and potential uses for some of the things laid out here, but if you have hung with me this long, thank you for one, but I commend your fortitude.
Informed mistakes. Best we can do. I am reminded of what the late In This League Army legend Dusty “The American Dream” Rhodes helped me understand; a bad outcome does not necessarily mean it was a bad plan. This was our best try at starting to sneak a peek at what a fantasy “book” may tell us about the consistent evaluation of prospects we could use to steer ourselves closer to winning our leagues. It’s a fantasy, but I feel a little more truth in my gut now.
(Photo by Brian Rothmuller/Icon Sportswire) (Photo by John Adams/Icon Sportswire) (AP Photo/Rick Scuteri, File) Steve Cheng / Wiki Commons


Great insight – great article – thanks! The house wins in the aggregate. Take the proven MLB players with a down/injured season over the “not-so-elite” prospects.
Thanks Dave. Hope it helped in some way. Helped me get a better idea of some things.