






Here at Pitcher List, we have a suite of PLV metrics to analyze every pitch in a baseball game. Decision Value (DV) is our hitter swing decision metric. It takes inputs like pitch velocity, location, and movement, and tells us whether the hitter made a good decision to swing or take a particular pitch. This isn’t quite as simple as plate discipline; swinging at a Logan Webb sinker and pounding it into the ground is a bad outcome even if the pitch was a strike.
Instead, Decision Value rewards hitters for swinging at pitches they should be able to hit hard, and for taking pitches they’re unlikely to do much with. The flipside is that Decision Value punishes hitters if they don’t swing at pitches they should be doing damage on or do swing at pitches that are unlikely to generate quality contact. You can find a much more thorough introduction to PLV metrics and Decision Value here.
Swing decisions can vary wildly by team for a handful of reasons. If you think back to the Moneyball A’s, the lineup was constructed with a focus on the most patient hitters. At that time, walks were undervalued, and so the A’s selected a group of hitters that consistently chose not to chase and were available on the cheap. Teams are also trying to train hitters to have particular approaches at the plate. In a David Laurila article from a couple of years ago, Rangers GM Ross Fenstermaker discussed the team’s attempt to standardize their player development processes, including “swing decisions and quality of approach.” So, with that in mind, let’s use this week’s edition of PLV DV Weekly to highlight the differences between how teams approach swing decisions.
Los Angeles Dodgers – 108 DV
The Dodgers have made the best swing decisions in baseball thus far in 2026. When you consider that the lineup is mostly unchanged from 2025 aside from the addition of Kyle Tucker (122 DV), it’s not surprising to learn they also made the best swing decisions last year. While none of the Dodgers are at the very top of the DV rankings, the Dodgers’ lineup is deep in batters with excellent plate approaches. The aforementioned Tucker leads the team, but Will Smith, Mookie Betts, Alex Freeland, and Freddie Freeman are all at least one standard deviation better than average by DV.
The Dodgers get their ranking by making good decisions on pitches both in and out of the zone. They are among MLB’s best teams on pitches outside the zone, with a 104 DV tied for 2nd with three other squads. The Dodgers have the second-lowest chase rate in baseball, and when they do swing outside the zone, they make contact at the 6th-highest rate. The Dodgers are tied for third in MLB with a 97 zDV despite ranking 10th in zone swing rate. Freeman, Dalton Rushing, and Tucker lead the charge in the zone, swinging at pitches Statcast labels as meatballs at a rate 10 percentage points above league average.
Milwaukee Brewers – 107 DV
The Brewers also ranked highly by this metric in 2025, tying with the Dodgers for the best DV in baseball at 109. Like the Dodgers, the Brewers don’t have any of the absolutely elite hitters by DV, but feature many good decision-makers. The Brewers’ part-time players have notably good approaches, with Brandon Lockridge, Gary Sánchez, and Andrew Vaughn leading the team.
In contrast to the Dodgers, the Brewers have a big split in their in-zone and out-of-zone decision metrics. The Brewers have the best oDV in the league but rank near the bottom with a 94 zDV. The huge split is due to an overall passive approach at the plate that appears to be by design. The Brewers chase fewer pitches outside the zone than any other team in MLB, but also have the second-lowest zone swing rate in baseball. Lockridge, the highest-ranking Brewers hitter by DV, swung at 51% of pitches in his time in San Diego. After spending an offseason with Brewers coaches, he’s swinging at just 43.6% of pitches this season. Vaughn started his career with the White Sox swinging at 45% of pitches, gradually increasing to nearly 50% before he signed with the Brewers. In his first half-season in Milwaukee, Vaughn cut his swing rate by 5 percentage points, and it’s down another 3.8 percentage points to just 40.9% this season.
In this case, I’d attribute the Brewers’ swing rate to a coaching decision. Vaughn and Lockridge weren’t particularly passive hitters before joining the Brewers, but they’ve become so with time in the organization. Longer-tenured players like Brice Turang and Jake Bauers have seen their swing rates decrease over the previous two seasons as well. Eric Theisen, the current lead hitting coach for the Brewers, joined the major league staff before the 2025 season, along with Al LeBoeuf, who has since moved into player development with the organization. Without any inside information, my guess would be that this is a shift in philosophy driven by the coaching staff or organization at large. Oh, and this year? Daniel Vogelbach, he of the 33.7% career swing rate, joined as a new hitting coach.
Chicago Cubs – 106 DV
It must be something in the water in the NL Central, because the Cubs have a similar split to the Brewers between their zDV and oDV. The Cubs’ metrics are a bit less pronounced, but they sit with a 95 zDV and a 104 oDV as opposed to Milwaukee’s 94 and 105. Like the Brewers, the Cubs are passive at the plate, swinging at the second-fewest pitches in the majors. The Cubs have the fifth-lowest chase rate in the majors, while swinging at the third-fewest pitches in the zone.
The Cubs swing decision standouts are led by Alex Bregman, who has always shown an excellent approach at the plate. His power might be missing this year, but his walk rate is up to 11.4%, the highest he’s seen since 2023. Michael Busch and Dansby Swanson are also having strong seasons from a swing decision perspective. Swanson has had some ups and downs over the course of the season, but for the most part his swing decisions have remained consistently strong.
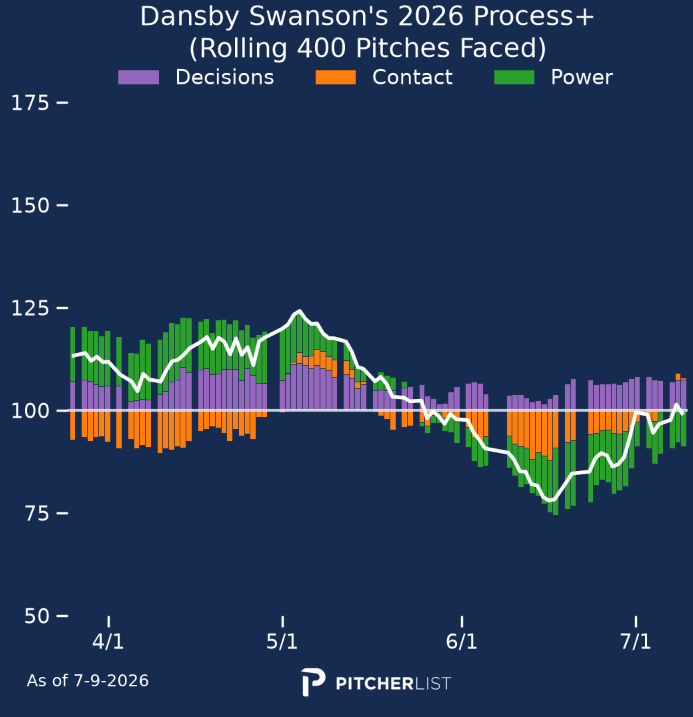
Keep in mind that these rolling charts are a moving average of the previous 400 pitches seen. Swanson has seen about 3.8 pitches per plate appearance this season, so the valley in early-mid June includes a large share of Swanson’s awful May. While Swanson has generally made good swing decisions this season, his approach is worse than in previous years. He’s chasing more than he has since 2022, while swinging at fewer strikes than he has since 2019.
New York Mets – 100 DV
The Mets have had the biggest change in their team DV since 2025, decreasing by 8 points. The Mets finished 2025 with a 108 DV thanks to a combination of strong decisions inside the zone (tied for 5th in zDV) and outside the zone (tied for 1st in oDV). This year, the zDV has remained strong at 97, but their oDV has dropped 5 points as a team. As opposed to the Brewers, the Mets have had a huge turnover in personnel over the past year, leading to the drop.
Juan Soto still has an elite approach, ranking 17th in baseball with a 122 DV, but he’s an outlier in the lineup. In 2025, the Mets gave 1114 plate appearances to Brandon Nimmo and Jeff McNeil. Setting aside any other virtues or flaws these two might have, they both had excellent plate approaches. McNeil had a 119 DV, courtesy of an aggressive approach inside the zone (75.3% zSwing) with a manageable chase rate (26.3%). Generally speaking, we’d consider a hitter to have a good approach if they have a 40-point split between their zSwing and oSwing; McNeil was at nearly 50 points. Nimmo chased only 24.2% of pitches while swinging at 66.2% in the zone, yielding an 118 DV in 2025. Pete Alonso, another hitter with an above-average approach, also left the team. Nimmo, McNeil, and Alonso were three of the six Mets with the most plate appearances last year, with Nimmo and Alonso both above 650 plate appearances.
Instead, in 2026, they’ve been replaced by Bo Bichette, Marcus Semien, and Carson Benge. While Bichette and Alonso don’t play the same position on defense, the Mets have mostly deployed Mark Vientos at first base after he played predominantly third base in 2025. Semien has a strong approach, posting a 116 DV this year that is essentially a wash with McNeil. Benge’s 104 DV is slightly above average. A bit worse than the 109 DV Alonso posted in 2025, but not a huge change. Bichette, on the other hand, has one of the majors’ worst approaches, and it’s gotten worse in his first season in New York. Bichette is chasing 39.6% of the time, his highest rate since a 29-game sample in 2020. His zone swing rate has fallen off a cliff as well. Bichette still swings at 68.9% of strikes, more than the average MLB hitter does, but significantly fewer than he used to. Peak Bichette, from 2021-23, chased a lot (36.7% oSwing), but was incredibly aggressive in the zone (78.2% zSwing). Even with an elevated chase rate, Bichette used to hit that 40-point split in zone swing vs chase rate. This year, he’s down to under a 30% split. Combined with a bit of a step back in Soto’s still-elite approach, the Mets have the 11th-highest chase rate in baseball this year after ranking 26th in 2025.
Colorado Rockies – 89 DV
Last, and in this case also least, we have the Colorado Rockies. This isn’t just another tired excuse to pile on the Rockies; at this point last year, they had a 63(!!) DV. The fact that they managed to close the gap with the rest of MLB and end the season with a 92 DV is remarkable in itself. The Rockies have had a bunch of lineup turnover with a new front office taking over, so it would be reasonable for the team to have a different approach at the plate. The 2026 Rockies have, instead, leaned further into the plate approach of the 2025 Rockies.
The Rockies are the most aggressive team in baseball at the plate for the second year running. Their 97 zDV is a strong mark, tied with the Dodgers and others for third in MLB. The Rockies have the worst oDV in baseball, though, driven by exceptionally high chase players like Ezequiel Tovar, Hunter Goodman, and Mickey Moniak. As a team, the Rockies lead the majors in chase rate at 34.1%, which would rank 39th of 149 qualified hitters in MLB. The Rockies also lead MLB in zone swing rate at 72%, slightly more than 2 percentage points above the second-place Athletics. Despite seeing the fewest pitches in the zone, they still lead MLB with a 51.5% swing rate. They’re the only team in baseball to swing at more than half the pitches they see.
While Tovar and Moniak have always been high swing rate hitters, I’m inclined to believe this is an intentional choice by the organization. Coors Field is the most hitter-friendly park in the majors because contact is heavily rewarded there. In Coors, hitters have an 114 wOBA on contact despite a 102 xwOBA on contact. That means that once you strip out the launch angle and exit velocity of the batted ball, hitters are getting way better results on contact in Coors than elsewhere. One piece of evidence that’s consistent with this theory is that the A’s have the second-highest swing rate in baseball. The A’s swing a ton despite Sutter Health Park assisting in drawing walks. Sutter Health Park also has the second-largest split between wOBA on contact and xwOBA on contact. In these parks, contact is so much better than anywhere else that teams have decided to prioritize swinging, even if it costs them on pitches outside the zone.
