


Baseball analytics in both the public and private spheres have progressed exponentially over the past few years. We have one-size-fits-all value-based stats. Percentages based on the strike zone, swings, and contact. Centralized batted ball and pitch tracking data. Advanced models based on the biomechanical specs of a pitch (one of them was created right here at Pitcher List!), with others for bat path potentially soon to follow. Through the bottomless wormhole that is baseball statistics, what’s the one lesson that is universal to understanding them all?
The first place my mind goes is sample size. It matters! And that’s whether you’re looking at the most ancient, surface-level metric or something that ends with a plus sign.
But after that? Context matters. In some instances, more than we realize. There have already been numerous successful attempts at taking context into account for the numbers we know and love. wRC+. Any ‘plus’ stat, for that matter. Run value. Take swinging strikes, for example. The frequency at which a pitcher accumulates swinging strikes, especially in tandem with called strikes, has long been one of the quickest and easiest predictive indicators to understand about pitchers. There isn’t yet a context-neutral version of swinging strike rate in the mainstream, but the likelihood of a swinging strike in any given situation can change based on the pitch type, count, location, etc.
This is an idea that Sky Kalkman, long-renowned baseball researcher, floated to Pitcher List’s very own Director of Data Analytics and Research, Kyle Bland, a couple weeks ago. Sky was thinking about young White Sox pitcher Grant Taylor, whose stuff is absolutely filthy, and how he has been living in the strike zone with decent overall swing-and-miss rates. He had a point to make that the amount of bats he’s missing is impressive considering how often he’s in the zone. Luckily, Mr. Bland had an answer ready: Sky’s intuition was correct! Taylor’s four-seam fastball led MLB (at the time) in Swinging-Strike-Rate-Above-Average – “average” being the expectation after accounting for pitch type, count, and attack zone (heart, shadow, chase, and waste as defined by Statcast).
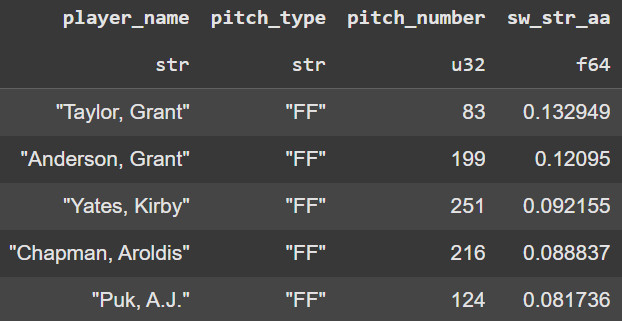
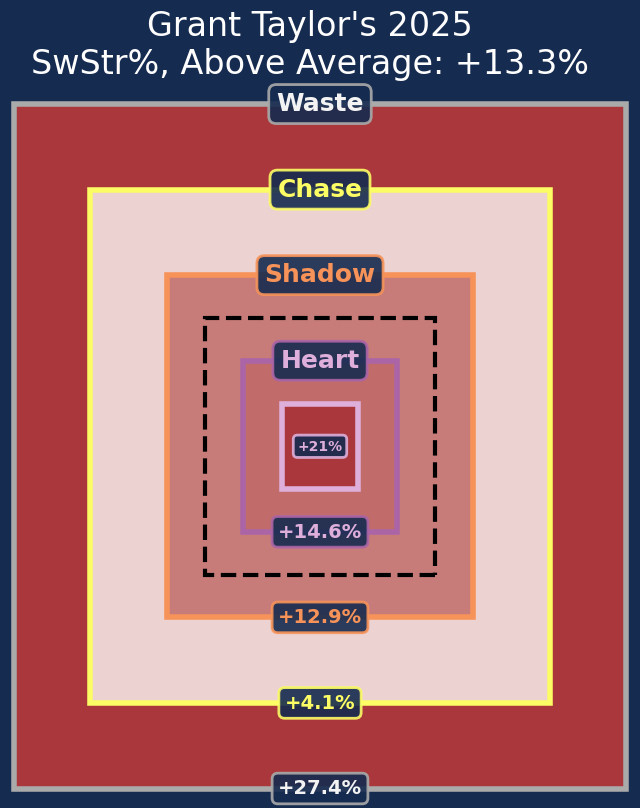
When looking at four-seam fastballs only, Taylor’s swinging strike rate becomes that much more impressive given his location. Overall, he has a 54.3% zone rate and an 11.7% meatball rate. Someone who lives in the zone this much should not be missing this many bats, yet Taylor, who averages 99 MPH on his fastball with well over seven feet of extension, manages. The offering has a 22.7% swinging-strike rate. Meanwhile, from the standpoint of an entire arsenal, Colorado lefty Austin Gomber is running an overall swinging-strike rate of 8.3% – not great by any means, but not low enough to be in the basement of the league. However, relative to his usage in certain counts and his location patterns, we’d “expect” a swinging-strike rate of approximately 14.3%. This difference of -6% is in the bottom 10 among everyone with at least 100 pitches thrown in MLB this season.
To illustrate why contextualizing swings and misses is necessary, let’s look at how the combination of pitch type, location, and the count affects hitters. The following data looks at the entire league from 2022-2024. As you can see, certain pitches are far more likely to elicit a swinging strike than others:
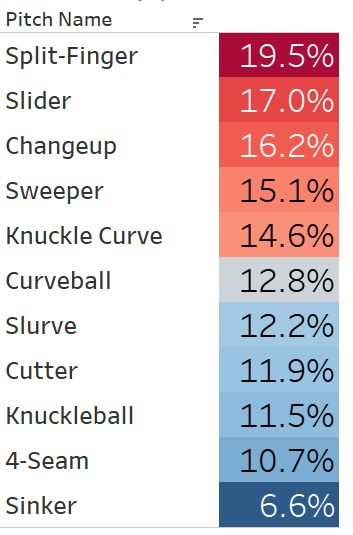
MLB SwStr% by Pitch Type (2022-2024)
Now, this doesn’t mean everyone should throw splitters all the time. There’s a predictability factor behind the swing and miss, too. What it does show is that the baseline expectation of a pitcher’s ability to generate swinging strikes should probably be higher if they make use of a splitter versus if they’re primarily a sinker-baller. Maybe I shouldn’t be, but I’m nonetheless struck at how low four-seamers are on this list, which might be a subtle hint as to why arsenal diversification is becoming a more prominent trend around the league.
Grouping swinging-strike rate by pitch location also reinforces some general trends that are key to understanding the nature of SwStr% Above Average:
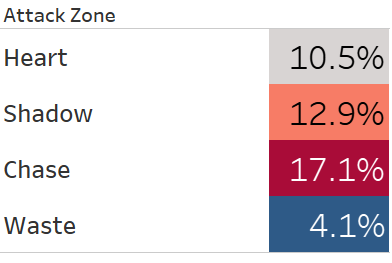
MLB SwStr% by attack zone (2022-2024)
This is a little more intuitive than looking at it by pitch type. Swinging-strike rate in the shadow zone is slightly higher than the heart zone because, while still in the same neighborhood as the plate, it’s farther away from hitters’ swing paths. It peaks in the chase zone even though hitters swing less at pitches here than they do in the heart or shadow of the plate, because they’re far likelier to come up empty. Pitches in the chase zone are close enough to tempt less disciplined hitters to swing, and far enough away to miss bats frequently. Meanwhile, this outcome is far less common in the waste zone because, well, hitters rarely swing here. There aren’t going to be as many swinging strikes on pitches that are immediately detectable as nowhere near the zone because there aren’t going to be as many swings, period. In general, pitchers who routinely pound the heart of the plate but generate swing and miss anyway, or alternatively, get hitters to swing at their least competitive offerings, should be given more credit for those swinging strikes than those who creep close to the shadows of the zone.
The count is another thing that influences swinging-strike frequency. See below:
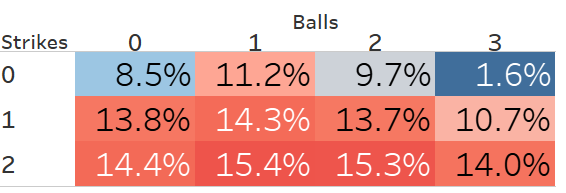
MLB SwStr% by count (2022-2024)
Pitchers aren’t going to give hitters anything to square up with two strikes, so it makes sense why swinging-strike rate peaks in that situation. Meanwhile, the vast majority of 2-0, 3-0, and 3-1 counts are either met with aggressive green lights for guys with power, or a firm take sign for guys whose primary job is to pass the baton. No surprise about the swinging-strike rate there either. Now that the three main factors affecting swinging strike frequency have been highlighted, we can put it all together. A hypothetical pitcher who accumulates swinging strikes on four-seamers or cutters right down the pipe in hitter-friendly or neutral counts is far more impressive than one who gets by on spin, movement, and generating two-strike chase. It’s all relative to expectation.
When I asked Kyle Bland what he thought was the most important way to understand the metric he authored, he responded with the following:
“The most interesting idea to me is to contextualize pitchers who use their pitches in atypical counts (fastballs with two strikes, early secondaries, etc.). Those will make their stats look different than league average, due to hitter behavior in different counts.”
Another part of the beauty of this to me is its technical simplicity. There’s no modeling or complex formulae – simply finding league-average swinging-strike rate by pitch type, attack zone, count, and handedness, and measuring each pitcher’s swinging-strike rate relative to that. What’s great about this approach is that you can apply it to way more than just swinging strikes. Swing rate, called-strike rate, contact rate, and wOBACON aren’t context-neutral either, but those are just a few examples that warrant their own introductions on another day.
Now that I’ve explained (with the huge help of the man himself, Kyle Bland) the essence of swinging-strike rate above average, let’s get to everyone’s favorite part: Leaderboards, both overall as well as sliced and diced by locations and pitch types. Enjoy.
All figures entering July 15, 2025 unless otherwise stated.
