


What do you think of when you hear the term “slugger” in the context of Major League Baseball? Your thoughts are likely drawn towards hitters like Kyle Schwarber or Pete Alonso, hulking behemoths who launch baseballs into orbit 40 to 50 times a year.
From a modern scouting and player development perspective, you might think of a guy like Ronald Acuña Jr. with his 121.2 MPH (!) max exit velocity and top-of-the-line bat speed. After all, it only makes sense that the best path to power production is to hit the ball as hard as possible as frequently as possible.
Regardless of how you define the term, you’re likely looking at figures ranging from home run totals and slugging percentage to exit velocities and barrel rates in order to identify the best sluggers in the game. Hitters who populate the leaderboards in all of these areas are quite often the biggest power producers the sport has to offer.
But what about hitters who put up slugger-ish home run totals without the elite batted ball figures or dizzying exit velocities of an Acuna or Schwarber? The knee-jerk reaction for players of this ilk is to call them lucky and their production unsustainable. Maybe they play in a particularly homer-friendly ballpark or maintained an unreasonable HR/FB ratio in a given season.
That conclusion wouldn’t be far off-base. Historical trends do show that the best way to sustain power production is to simply pulverize the baseball at decent angles, after all.
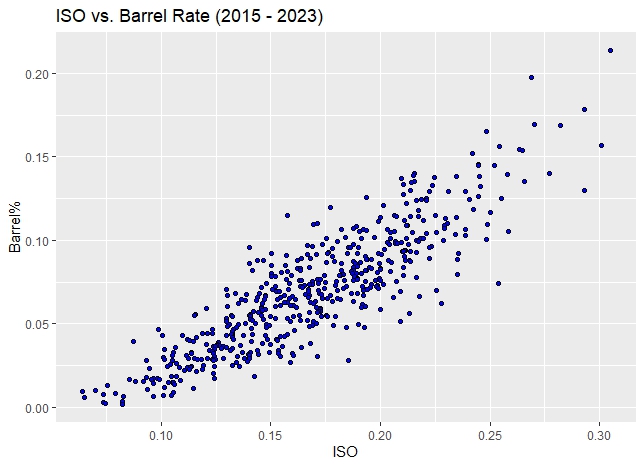
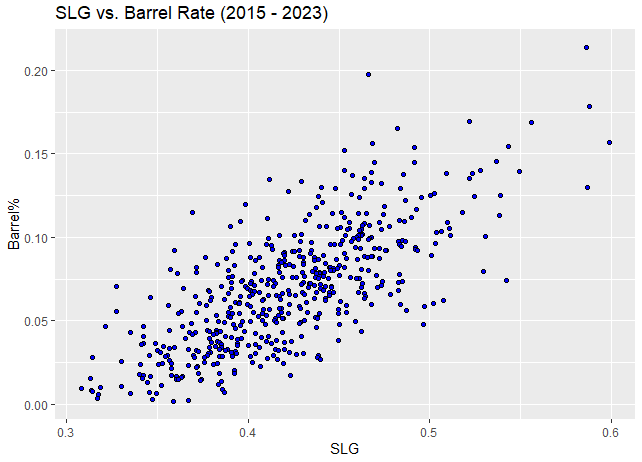
This, however, doesn’t paint a full picture of the modern slugging landscape. The r-squared values we’re seeing here are only about .75 and .40, respectively, so there are likely several other factors at play here. What if some of the hitters in the bucket that we would instinctively call “lucky” are intentionally tailoring their hitting approaches to maximize power output in spite of pedestrian batted ball metrics?
In other words, while hitting the ball 110+ MPH on a routine basis is still the best route to sustainable power production, what if it wasn’t the only route?
It’s All About The Angles
A hot topic of discussion over the last handful of seasons has been the rise of launch and spray angles and how their optimization can influence power outcomes, especially for hitters without high-end batted ball quality.
The main takeaway from this ongoing discussion has largely been that pulling the ball and lifting it in the air is the best possible batted-ball outcome from a power perspective. That makes intuitive sense. Hitters generally produce better exit velocities on balls hit to the pull side, and it’s certainly more difficult for groundballs to result in extra-base hits.
Alex Chamberlain recently published a great piece over at FanGraphs detailing why pulled fly balls have quickly become the most sought-after result for hitters across the league. As he points out, pulled fly balls have by far the best wOBA among all possible combinations of spray direction (Pull, Center, Oppo) and batted-ball type (flyball, groundball, line drive, popup) at .937. The next closest is pulled line drives at .755. Put simply: If you want to do damage, hit fly balls to the pull side.
Just ask Isaac Paredes, who has become somewhat of a poster child for this movement. When he was acquired by the Rays prior to the 2022 season, he was a young hitter with good plate skills but underwhelming power production given his selectivity and athleticism. Once he arrived in Tampa Bay, however, the directive was to totally sell out for pulled fly balls. With that change, he has become arguably the biggest power threat on a competitive team two years running.
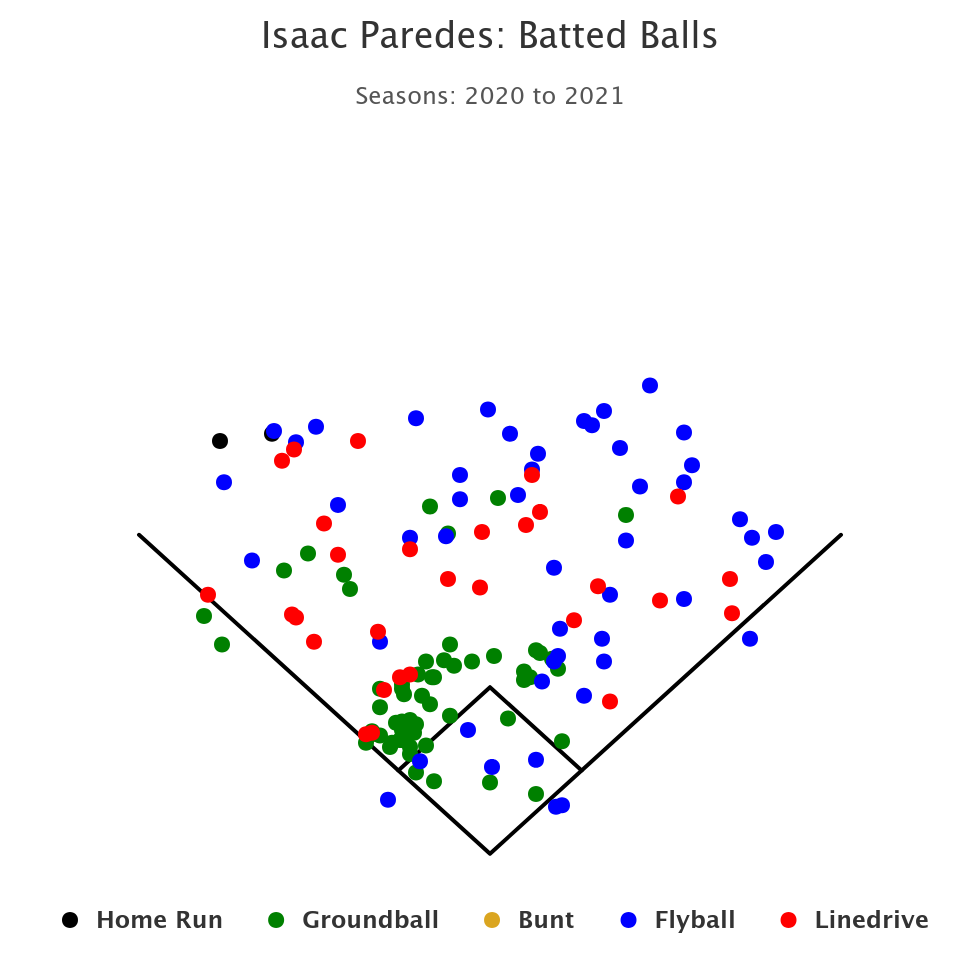
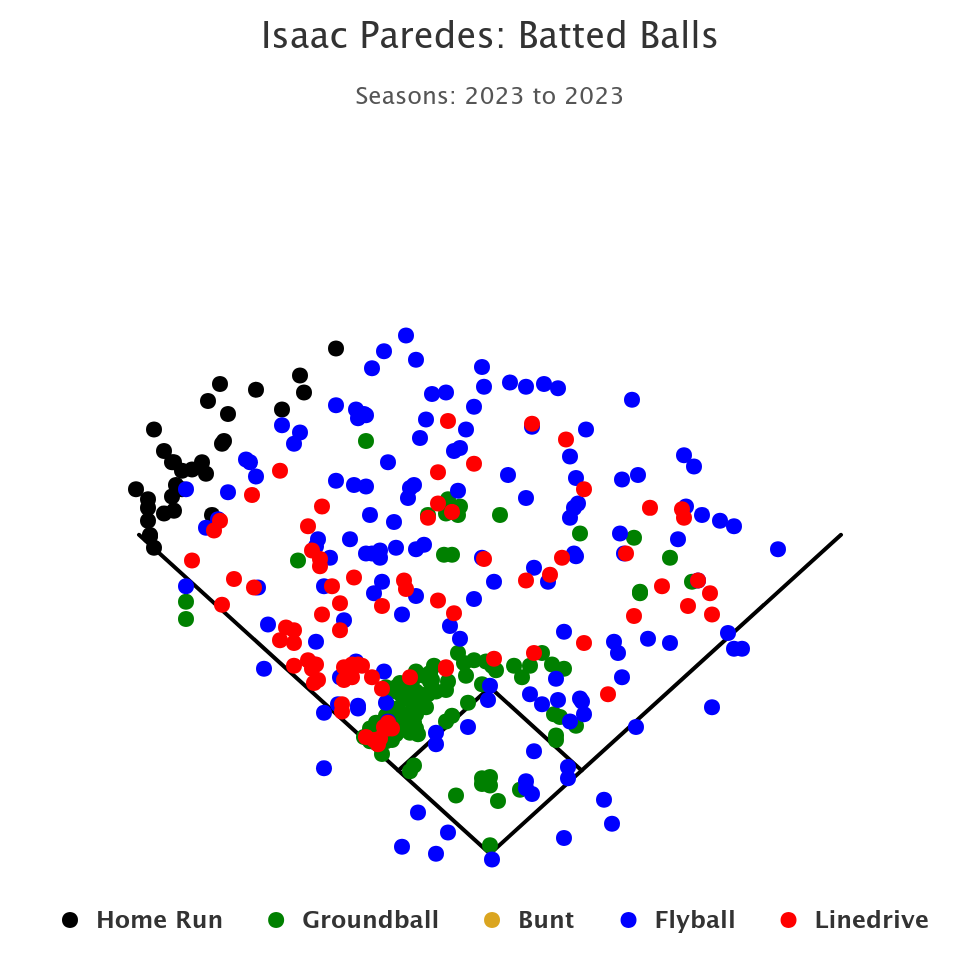
Looking at his career batted-ball spray chart, Paredes has never hit a home run at the major league level to any part of the field except into the left-field seats. He’s amassed 53 home runs as a big leaguer and not a single one has been hit right of left-center field. It’s a remarkably focused approach. One may even call it one-dimensional.
The important thing about Paredes’ approach is that it has allowed him to maintain his status as a real home run threat in spite of his lackluster batted-ball metrics. He only ranked in the 29th percentile for barrel rate in 2023. He was in the 6th percentile in hard-hit rate, 13th percentile in average exit velocity, and even his max exit velocity sat at just 107.7 MPH. By all means, Paredes is a hitter that a cursory look under the hood would deter you from getting too excited about.
And yet, he’s the very type of hitter I’m trying to identify and learn more about here.
So, as a sort of exploration into the potential of batted ball optimization, I set out to create a rudimentary machine learning model that could help me pick out some other hitters who may be selling out for pulled fly balls to maximize their power output, as well as some hitters who could potentially benefit from doing so.
Power Optimization (PwrOpt)
The goal here was to isolate what makes a hitter like Paredes so good at over-performing his raw batted ball quality and build a model that would essentially pinpoint other hitters who are doing the same. Naturally, some of the primary inputs for the model are figures that are intrinsically linked to the concept, like fly-ball rate, ground-ball rate, and pull rate.
Another aspect of this approach that I think makes a sizable difference in a hitter’s ability to successfully pull the ball in the air is pitch selection. As someone who has watched a good portion of Paredes’ MLB plate appearances, one thing that stands out about his swing decisions is how aggressive he is on pitches up in the zone and in on his hands. His naturally strong plate discipline likely translates into an ability to reliably identify pitches that he can pull in the air with regularity.
This is what led me to incorporate measures of zone aggression and pitch selection into the model. Admittedly, it was difficult to decide on exactly what metric to use here, as much of the publicly available swing decision figures don’t represent the entirety of what I’m trying to capture.
To put it succinctly, I wanted this model to reward hitters who pull the ball in the air frequently and are aggressive on pitches that give them the best chances to pull fly balls without considering raw power figures like barrel rates or exit velocities. Essentially, this is a gauge of how close a hitter is to deploying an ideal approach for power production.
At its very core, the model is meant to predict a new ISO score for a player based on how well they deploy these skills. Because of this, it is scaled similarly to ISO and can be thought of as a measure of “power maximization proximity”.
It’s not a perfect methodology by any means, but the 2023 results I obtained when training the model on 2015-2022 batted ball data suggest it might actually be a worthwhile tool to explore and ideally refine for player development purposes.
With that preface out of the way, here is a Google doc with the results for every hitter with at least 50 plate appearances in the 2023 season. As a quick overview, I’ve posted the top 20 power optimization scores below.
First things first, I always like to do a quick sanity check with analysis like this to make sure I can at least somewhat confidently draw some conclusions based on the results. Looking at both extremes of the board, there are definitely some faces you’d expect to see.
Isaac Paredes ranks in the 96th percentile in a model that was largely inspired by his approach, which is a good sign. Other well-known pulled fly ball savants, including Alex Bregman (86th percentile), Joey Gallo (99th), and Max Muncy (91st) also make appearances at the top end of the leaderboard. Likewise, a lot of less power-oriented spray hitters litter the bottom end of the chart. Guys like Nick Madrigal (2nd percentile), Steven Kwan (5th), and Luis Arraez (7th) all make appearances in the bottom 10% of the league.
This is all good to see when checking whether the model passes the initial smell test. Now we can start to identify some of the names that stick out here on both the positive and negative side and draw some conclusions on the most effective way to use a model like this.
Interpretations and Takeaways
After all the exploration we’ve done into the world of pulled fly balls and statistical modeling, I think it’s important to take a step back and discuss what lessons we can learn from an analysis like this. At the end of the day, the ultimate goal here was to create something that gives us actionable information regarding player evaluation and development.
What I’ve learned while building this model is that when you really break it down to its core components, it works best when used in tandem with other measures of power production and batted ball quality. It’s akin to a sort of “expected power based on approach” metric, and that can only tell us so much on its own.
It can be tricky to use it in this light, however. What does an extremely strong or poor power optimization score tell us about hitters in relation to their current power output?
On the one hand, if a hitter has a strong PwrOpt score but poor power production, you could almost consider them a lost cause in the power department, barring any sudden drastic physical changes. On the other hand, a hitter with a very poor PwrOpt score but very strong power results would lead you to believe that the hitter could be the spiritual successor to Barry Bonds if they just pulled more fly balls, which isn’t entirely accurate.
I think the real potential source of value here would be finding hitters with near-average existing power production, but a poor optimization score. These are the guys who could conceivably unlock a new level of slugging ability with an adjustment to their approach at the plate and perhaps some mechanical adjustments to their swing.
With that in mind, I’ve compiled a list of players who fit this profile in 2023. Here are some hitters who posted an average-ish ISO last year with an approach that wasn’t conducive to power production according to the model.
Another thing that I think is important to understand about this analysis is that, for many hitters who fit the profile shown above, trying to tailor their approach for more power might not be totally beneficial. Hitters like Bo Bichette generate a lot of value just by being a hitter who can make contact with almost anything and hit it with authority to any part of the field. It’s how he’s maintained such a strong batting line over his career despite relatively poor plate discipline.
That is why I think comparing this metric to batted ball quality measures like barrel rate can be so valuable.
Take a guy like Nick Madrigal, for example. He has a very poor power optimization score, leading one to believe he could potentially hit for more power with a change in batted ball focus. However, he’s also had bottom-of-the-barrel exit velocities and barrel rates over the course of his career. Because of that, it likely wouldn’t be worth it to sell out for a more power-focused approach in exchange for a potential dip in average. He’s better off sticking with his current approach.
For someone like Yandy Díaz, however, there is a fair argument to be made that he could benefit from a change. Not to criticize someone coming off of winning an AL batting title, but given how hard he hits the ball and his exemplary plate skills, I’m convinced he could hit upwards of 35+ homers per season while still hitting around .300 if he did what he was doing in the first half of the 2023 season in terms of spray and launch angles.
So, one of my primary takeaways from this is that some level of nuance is required when using a metric that isolates a plate approach like this one. Not all of the hitters who score highly here are good hitters, and not all who score poorly are bad hitters. It’s at its most effective when used in conjunction with other batted ball metrics to identify potential sources of positive and negative value.
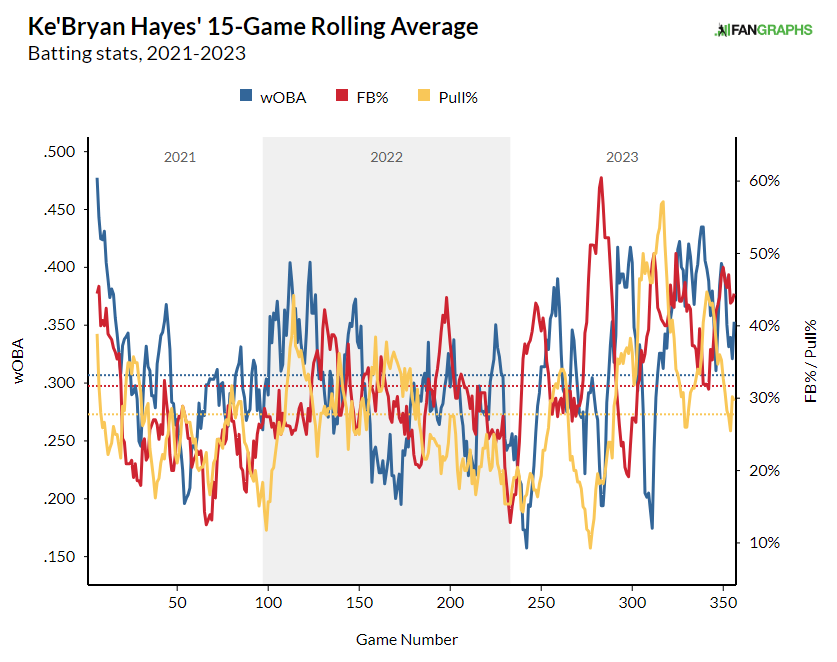
A good use case for the model would be in evaluating players like Ke’Bryan Hayes and Elly De La Cruz. Both of these promising NL Central infielders scored poorly in PwrOpt (14th and 7th percentiles, respectively) and look like good candidates for a more power-focused approach.
Hayes has more big-league experience than De La Cruz, but has been sort of a perennial frustration for analysts because of his insistence on running high groundball rates despite solid batted ball data. Over the course of his 3-year career, it’s clear he’s at his best when he’s making an effort to lift and pull the ball.
De La Cruz is a more exaggerated example of largely the same issue. For someone with a solid barrel rate and a 100th percentile 119.1 MPH max exit velocity, he runs an unacceptably high 54% ground-ball rate, below-average pull rate, and is surprisingly passive on hittable pitches. That all translates to a 7th-percentile power optimization score. Obviously, this is something that will need to improve if he is to capitalize on his obscene physical tools and athleticism.
That brings me back to my previous point about it being merely situationally valuable for players to deploy this more power-focused approach. Is it really important for a guy capable of hitting the ball 120 MPH to pull the ball?
Ben Clemens broke this question down in great detail in this article about which hitters benefit most from pulling the ball at high rates, and what he found has interesting implications for my model. Essentially, it was more valuable for hitters with lower exit velocities to pull the ball at a higher rate.
This means that a guy like Isaac Paredes benefits more from pulling his fly balls than someone like Elly De La Cruz would thanks to the lower exit velocity band he falls in. Put concisely, pulled balls outperform their xwOBA at average to below-average exit velocities.
Thinking of ways to alter the model to make it more accurately reflect the ability of hitters to maximize their batted balls for power production, including some measure of exit velocity might actually be more productive than I initially thought. Maybe the model should reward guys who get to solid power figures without elite exit velos instead of just identifying them.
It also might be beneficial to investigate the effects of pull rate changes on an individual basis and do some tinkering with weights to capture the true importance of pull rate relative to fly ball rate in those exit velocity bands.
At the end of the day, it looks like I’ve come out of this analysis with more questions than answers. That’s not a bad thing, as research into batted ball optimization is a burgeoning field and I can only do so much with publicly available data at my disposal.
For now, though, I think my goal of creating a model that allows us to identify hitters capable of optimizing their power production with ideal launch angles, spray angles, and pitch selection was relatively successful. The model needs some serious refinement after more research into the topic, but I think this was a good starting point.
Photos courtesy of Icon Sportswire | Adapted by Aaron Polcare (@bearydoesgfx on X)
