


Blake Snell has been flummoxing hitters and analysts alike his entire career but took it to another level in 2023. The strengths are obvious: he won the 2023 NL Cy Young with an incredible 2.25 ERA (best in MLB for starters) across 180 IP, with a 31.5% strikeout rate (98th %ile) and a matching 31.5 CSW% (95th %ile). He’s a strikeout artist (29.7% career K rate), who has shown that he can overpower hitters and send them to the dugout shaking their heads. He’s also not without his warts: he had a 13.3% walk rate last year (3rd %ile) and has averaged >10% for his career. When you give away that many free passes, you are subject to the dangers of batted ball luck: Hits drop, which brings the runners on base home, and your ERA goes up. It’s easy to see how this profile can come crashing back to Earth, even with the gaudy strikeout rate. So how does he manage to walk so many hitters, while also keeping his ERA in check? Is he simply lucky? A look at his BABIP (0.256; 91st %ile) and LOB% (86.7%; 98th %ile) certainly indicates that he has been. That’s not a fun (or rewarding) explanation, though, and it’s lazy analysis to simply write him off as lucky and move on. I propose a different explanation for how he limited the damage from his BB% (and how he controls some of his BABIP/LOB%): He makes fewer mistakes, which means he allows fewer hits, which allows his K% to bail him out more often.
What is a Mistake?
That’s a fairly obvious thing to say: making fewer mistakes is better for the pitcher. The tricky part is defining what a “mistake” actually is. I went through several different permutations of what a mistake could be. Between actual results and estimated results with our PLV model, there is a deep sandbox of metrics to check and thresholds to tweak when looking for a definition. Is it a pitch that has a low expected CSW%? Is it a pitch that’s likelier to result in a barrel or other type of dangerous contact? Some ideas simply didn’t yield useful results, while others were overly complicated. After searching around for a useful and straightforward definition, it dawned on me: We already have thresholds for Quality Pitches (PLV >5.5) and Bad Pitches (PLV <4.5), and we can lean further into those categories to help us define a “mistake.”
Specifically, let’s look at Bad Pitches: a Bad Pitch is a pitch that, based on its characteristics (movement, velocity, location, and count), is expected to return poor outcomes for the pitcher, resulting in a higher-than-average expected run value for the pitch. Bad Pitches come in two flavors: those thrown out of the zone for a ball/HBP, or those thrown in the zone that are likelier to result in a hit. I wouldn’t generally classify pitches that are balls as a “mistake,” since pitchers generally use them to induce a hitter into a bad swing outside the zone, or they may have just missed their location. Those pitches happen, and we move on. The more interesting genre of Bad Pitch is the Bad Pitch in the zone. Those pitches are expected to allow more runs by yielding more contact and/or more bases on contact. Pitchers don’t want more contact, and they definitely don’t want more bases. This will be our criteria for a Mistake: a Bad Pitch in the zone (aka a pitch in the zone with a PLV <4.5 ). From 2020-2023, 8.5% of all pitches have met these criteria, so roughly 1 in 12 pitches is classified as a Mistake Pitch. Given that we define Mistake Pitches as pitches in the zone, it’s also worth knowing that 18.8% of all pitches in the zone are classified as Mistake Pitches.
I’m a visual learner, so I always check to make sure things look like how I expect/hope them to look before I dig in further. Here is a chart of where Mistake Pitches reside, and how often they occur there (darkest red is >50% Mistake Pitches, lightest is <5%. Areas outside the strike zone are, by definition, 0%).
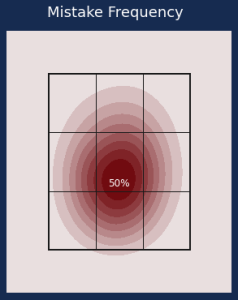
This passes the eye test! The most frequent locations are in the heart of the plate, where the hitter can do the most damage, and the frequency fades as you move toward the edges of the strike zone.
Now that we have a definition for what a Mistake Pitch is, we can dig in.
Analysis
Given that a Mistake Pitch is a Bad Pitch, and those are estimated to allow more and harder contact, that should be backed up by the data. If not, it’s back to square one of defining the metric. Thankfully, the results line up with our expectations: Mistake Pitches not only earn fewer CSW, but they yield ~2x as many hits per pitch and result in more bases on contact.
| Measure | In Zone, Non-Mistake | Mistake |
|---|---|---|
| Swinging Strike% | 12.1% | 10.0% |
| Called Strike% | 33.2% | 13.0% |
| Hits per Pitch | 0.083 | 0.159 |
| SLGcon | 0.564 | 0.634 |
Now that the metric is initially validated, let’s get into some more rigorous analysis of it, and then discuss applications. I’m a fan of showing more than telling, so get ready for some charts.
Stability
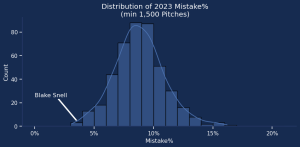
Research has shown that it can take ~400 pitches for the value of a pitcher’s location to stabilize, and that is similarly true for Mistake Rate, which stabilizes (Cronbach’s Alpha >= 0.7) at ~360 pitches.
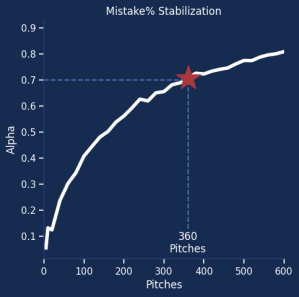
Using the 2023 MLB average of 16.6 pitches per IP, this means that we have a good idea of what a pitcher’s Mistake Rate talent is after about 22IP, or 4-5 starts. This is great because it means that Mistake Rate can be used when analyzing pitchers with a very limited sample of innings, like relievers or prospects.
Stickiness
A metric that stabilizes quickly helps us understand that the pitcher influences a metric (instead of it being influenced more by randomness/other variables). Another important measure of a metric’s ability to be innate to that pitcher is its year-to-year stickiness. If this is truly a pitcher’s skill, it should be fairly consistent from one year to the next, and Mistake Rate checks this box as well.
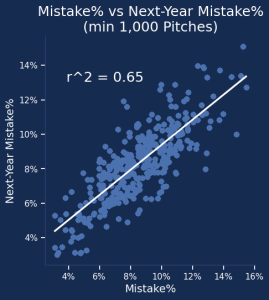
An r2 of 0.65 is strong and tells us that a pitcher’s Mistake Rate can be expected to continue from one season to the next. Combined with the relatively quick stabilization, this means that we can have an idea of what a pitcher’s Mistake Rate will be like in the next year, even if they don’t have a full season of innings to draw from.
Application
Descriptiveness
Now we have confirmation that Mistake Rate stabilizes early and is sticky year-to-year. That gives me confidence that this is a consistent stat that appears to be a measure of a pitcher’s skill. That’s all well and good, but there’s another question we need to answer: how is this useful? It’s a very important question and is one that I have learned to always keep in mind, because in the past I’ve spent too much time going down a rabbit hole of properly honing a metric, to then realize it’s merely a curiosity and doesn’t have any bearing on whether a player is good or not.
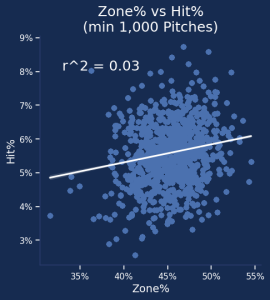
The biggest question I had for Mistake Rate was: how does it relate to batted balls (and hits, specifically)? Since Mistake Rate is a pitch-level stat, I looked at its relation to Batted Balls-per-Pitch (aka: is a pitch a field out or hit; labeled Batted Ball%) and Hits-per-Pitch (Hit%). I also included their relationship to Zone%, to make sure that there is a benefit brought by Mistake Rate above and beyond knowing that a pitch was in the zone or not. These charts are using all pitchers from 2020-2023 with at least 100 pitches thrown, weighted by the number of pitches thrown. We’ll start with Batted Ball%.
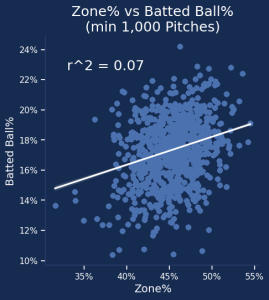
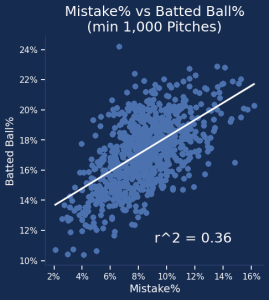
That’s an exciting improvement over Zone%! I’m quite happy with an r2 of 0.36 for estimating a pitcher’s ability to limit or allow batted balls, especially since there isn’t much of a relationship with Zone%. The Hit% charts show similar results.
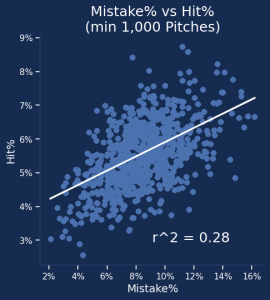
Both metrics are noisier than before, but that makes sense given how variable batted ball luck can be. Using only the characteristics of a pitch (with no information about who the batter is, what the defense behind them is like, or what park they’re in), we can have a loose idea of how many hits they’ll allow. In all, I’m quite pleased with Mistake Rate’s relationship to batted balls and hits, and will be using it as a shorthand for gauging how “hittable” a pitcher is.
Conclusion
We now have a metric designed to identify Mistakes thrown by pitchers. We’ve shown here that it checks all of the boxes I like to see from a novel metric: it’s relatively quick to stabilize, it’s sticky from year to year, and it helps us describe aspects of a pitcher’s performance that have a large impact on their observed results. Something else that pleases me is that this helps quantify some of the vernacular around baseball—it’s pretty easy to call a hanging curveball in a 2-strike count a “mistake,” but now we have a way to quantify if it actually was a Mistake Pitch, how often he throws them, and we know that it is a repeatable skill (or lack thereof).
This brings me back to Blake Snell. He just refuses to throw Mistakes. Only 3.2% of his pitches are classified as Mistakes, while Eury Pérez was 2nd (among pitchers with 1,500+ pitches), at 4.3%. Some of that has to do with him not hitting the strike zone (36.5% Zone rate; the lowest in baseball), but even when we control for Mistakes per Zone Pitch, Snell still leads the league by a relatively wide margin (8.6% Mistake/Zone, vs 10.1% for Pérez in 2nd). Snell’s strategy is to never miss in the middle of the zone, which will yield a high BB% if you have even average control, but he knows that his stuff will allow him to generate strikeouts there. That, combined with his lack of Mistake Pitches, means that he won’t be punished as harshly as someone like Zach Davies (also sub-40% Zone rate, but with less impressive stuff and twice the rate of Mistakes).
I’ll close with the 2023 Mistake Rate leaderboard for all pitchers with at least 1,500 pitches. Enjoy!
| Pitcher | Pitches | Zone% | Mistake% | Mistake/Zone |
|---|---|---|---|---|
| Blake Snell | 3,172 | 36.5% | 3.2% | 8.6% |
| Eury Pérez | 1,539 | 42.4% | 4.3% | 10.1% |
| Cristian Javier | 2,886 | 43.2% | 4.5% | 10.3% |
| Andrew Heaney | 2,605 | 43.0% | 4.9% | 11.4% |
| Freddy Peralta | 2,840 | 43.5% | 5.0% | 11.6% |
| Logan Allen | 2,134 | 44.4% | 5.2% | 11.8% |
| J.P. France | 2,206 | 48.2% | 5.3% | 11.0% |
| Michael Kopech | 2,432 | 41.7% | 5.3% | 12.7% |
| Spencer Strider | 3,104 | 47.4% | 5.4% | 11.4% |
| Dylan Cease | 3,268 | 40.7% | 5.4% | 13.3% |
| Zack Wheeler | 3,158 | 45.7% | 5.5% | 12.0% |
| Bailey Ober | 2,327 | 44.0% | 5.5% | 12.6% |
| Shohei Ohtani | 2,097 | 48.4% | 5.8% | 12.0% |
| Edward Cabrera | 1,809 | 37.9% | 5.9% | 15.6% |
| Shane McClanahan | 1,822 | 48.0% | 6.0% | 12.5% |
| Gerrit Cole | 3,287 | 46.3% | 6.0% | 13.0% |
| Nick Pivetta | 2,388 | 44.7% | 6.0% | 13.5% |
| Bryce Miller | 2,095 | 50.5% | 6.2% | 12.2% |
| Kodai Senga | 2,805 | 40.7% | 6.2% | 15.3% |
| Jack Flaherty | 2,638 | 42.1% | 6.3% | 14.9% |
| Ken Waldichuk | 2,559 | 44.7% | 6.3% | 14.2% |
| Kutter Crawford | 2,100 | 45.0% | 6.4% | 14.2% |
| JP Sears | 2,877 | 47.2% | 6.4% | 13.6% |
| Ryne Nelson | 2,359 | 50.3% | 6.4% | 12.8% |
| Zach Davies | 1,501 | 39.9% | 6.5% | 16.2% |
| Tyler Glasnow | 1,903 | 47.4% | 6.6% | 13.9% |
| Kevin Gausman | 3,073 | 42.1% | 6.8% | 16.1% |
| Michael King | 1,687 | 43.9% | 6.8% | 15.5% |
| Luis Castillo | 3,209 | 45.1% | 6.8% | 15.1% |
| Hunter Greene | 2,093 | 45.0% | 6.8% | 15.2% |
| Jesús Luzardo | 2,995 | 43.0% | 6.9% | 16.0% |
| Kyle Gibson | 3,039 | 43.0% | 7.0% | 16.2% |
| MacKenzie Gore | 2,462 | 44.0% | 7.0% | 16.0% |
| Bobby Miller | 1,962 | 45.8% | 7.0% | 15.4% |
| Lucas Giolito | 3,207 | 44.4% | 7.0% | 15.9% |
| Taj Bradley | 1,822 | 48.0% | 7.1% | 14.8% |
| José Berríos | 2,946 | 45.0% | 7.1% | 15.8% |
| Grayson Rodriguez | 2,104 | 46.9% | 7.1% | 15.2% |
| Andrew Abbott | 1,899 | 45.1% | 7.2% | 15.9% |
| Jordan Lyles | 2,821 | 44.6% | 7.3% | 16.3% |
| Max Scherzer | 2,469 | 46.4% | 7.5% | 16.1% |
| Sonny Gray | 2,828 | 46.0% | 7.5% | 16.2% |
| Yusei Kikuchi | 2,818 | 46.3% | 7.5% | 16.2% |
| Tyler Wells | 1,907 | 44.9% | 7.5% | 16.7% |
| Graham Ashcraft | 2,327 | 47.4% | 7.5% | 15.9% |
| Trevor Williams | 2,629 | 41.9% | 7.6% | 18.1% |
| Zac Gallen | 3,253 | 44.5% | 7.6% | 17.1% |
| Clayton Kershaw | 2,031 | 45.0% | 7.7% | 17.1% |
| Paul Blackburn | 1,880 | 40.8% | 7.7% | 18.9% |
| Alex Cobb | 2,514 | 43.2% | 7.7% | 17.9% |
| Anthony DeSclafani | 1,553 | 45.1% | 7.7% | 17.1% |
| Adam Wainwright | 1,793 | 45.5% | 7.8% | 17.1% |
| Lance Lynn | 3,174 | 43.8% | 7.8% | 17.8% |
| Nathan Eovaldi | 2,235 | 42.7% | 7.8% | 18.2% |
| Corbin Burnes | 3,082 | 41.6% | 7.8% | 18.7% |
| Dean Kremer | 2,933 | 46.3% | 7.8% | 16.9% |
| Patrick Sandoval | 2,631 | 44.4% | 7.9% | 17.7% |
| Aaron Nola | 3,095 | 44.6% | 7.9% | 17.7% |
| Chris Sale | 1,672 | 43.8% | 7.9% | 18.0% |
| Joe Ryan | 2,685 | 48.2% | 7.9% | 16.4% |
| Cole Ragans | 1,591 | 44.4% | 8.0% | 18.0% |
| Julio Urías | 1,854 | 49.1% | 8.0% | 16.3% |
| Tanner Bibee | 2,328 | 45.7% | 8.0% | 17.6% |
| Xzavion Curry | 1,503 | 49.0% | 8.1% | 16.4% |
| Cal Quantrill | 1,714 | 42.2% | 8.1% | 19.1% |
| Justin Verlander | 2,605 | 46.6% | 8.1% | 17.4% |
| Charlie Morton | 2,863 | 41.0% | 8.1% | 19.7% |
| David Peterson | 1,970 | 40.8% | 8.1% | 19.9% |
| Mike Clevinger | 2,105 | 46.7% | 8.1% | 17.4% |
| Michael Wacha | 2,226 | 45.9% | 8.1% | 17.7% |
| Touki Toussaint | 1,596 | 39.7% | 8.1% | 20.5% |
| Shane Bieber | 1,958 | 44.4% | 8.2% | 18.4% |
| Drew Smyly | 2,406 | 41.3% | 8.3% | 20.1% |
| Chris Flexen | 1,755 | 44.3% | 8.3% | 18.8% |
| Logan Webb | 3,184 | 45.6% | 8.3% | 18.3% |
| Brandon Pfaadt | 1,614 | 49.1% | 8.4% | 17.0% |
| Kyle Bradish | 2,642 | 45.8% | 8.4% | 18.3% |
| Nick Martinez | 1,756 | 41.7% | 8.4% | 20.1% |
| Josiah Gray | 2,817 | 41.3% | 8.4% | 20.3% |
| Ranger Suárez | 2,024 | 43.4% | 8.4% | 19.4% |
| Yu Darvish | 2,220 | 48.2% | 8.4% | 17.5% |
| Hunter Brown | 2,725 | 45.9% | 8.4% | 18.4% |
| Pablo López | 3,032 | 45.7% | 8.4% | 18.5% |
| Tanner Houck | 1,742 | 45.1% | 8.6% | 19.0% |
| Rich Hill | 2,537 | 48.7% | 8.6% | 17.6% |
| Tyler Anderson | 2,437 | 43.6% | 8.6% | 19.7% |
| Wade Miley | 1,876 | 44.0% | 8.6% | 19.5% |
| Alex Wood | 1,712 | 44.4% | 8.6% | 19.5% |
| Reid Detmers | 2,610 | 46.1% | 8.7% | 19.0% |
| Brayan Bello | 2,622 | 44.3% | 8.8% | 19.9% |
| Joe Musgrove | 1,562 | 43.9% | 8.9% | 20.3% |
| Domingo Germán | 1,655 | 44.1% | 8.9% | 20.3% |
| Sandy Alcantara | 2,728 | 47.7% | 8.9% | 18.8% |
| Carlos Carrasco | 1,593 | 40.5% | 9.0% | 22.2% |
| Martín Pérez | 2,233 | 43.0% | 9.0% | 21.0% |
| Alek Manoah | 1,700 | 41.9% | 9.1% | 21.6% |
| James Paxton | 1,692 | 46.0% | 9.1% | 19.8% |
| Tylor Megill | 2,237 | 45.1% | 9.1% | 20.2% |
| Jake Irvin | 2,150 | 47.8% | 9.2% | 19.2% |
| Zack Greinke | 2,222 | 45.4% | 9.2% | 20.2% |
| Austin Gomber | 2,167 | 49.1% | 9.2% | 18.7% |
| Jameson Taillon | 2,534 | 47.7% | 9.2% | 19.4% |
| Javier Assad | 1,714 | 44.3% | 9.3% | 20.9% |
| Logan Gilbert | 2,928 | 49.8% | 9.3% | 18.7% |
| Seth Lugo | 2,378 | 48.8% | 9.3% | 19.0% |
| Marcus Stroman | 2,208 | 41.2% | 9.3% | 22.6% |
| Clarke Schmidt | 2,716 | 47.5% | 9.4% | 19.7% |
| Taijuan Walker | 2,841 | 41.6% | 9.4% | 22.6% |
| Eduardo Rodriguez | 2,449 | 45.2% | 9.4% | 20.9% |
| Jon Gray | 2,403 | 47.2% | 9.4% | 20.0% |
| Merrill Kelly | 2,814 | 41.9% | 9.6% | 22.9% |
| Mitch Keller | 3,123 | 50.0% | 9.6% | 19.2% |
| Brandon Williamson | 1,942 | 47.0% | 9.6% | 20.5% |
| Tony Gonsolin | 1,670 | 41.7% | 9.6% | 23.1% |
| Michael Lorenzen | 2,370 | 46.6% | 9.7% | 20.7% |
| Aaron Civale | 2,010 | 46.2% | 9.8% | 21.1% |
| Joey Wentz | 1,933 | 45.9% | 9.8% | 21.3% |
| Adrian Houser | 1,859 | 44.8% | 9.9% | 22.1% |
| Johan Oviedo | 2,996 | 44.6% | 9.9% | 22.2% |
| George Kirby | 2,826 | 52.3% | 9.9% | 19.0% |
| Luke Weaver | 2,260 | 47.1% | 10.0% | 21.1% |
| Sean Manaea | 2,053 | 47.5% | 10.0% | 21.0% |
| Griffin Canning | 2,182 | 46.2% | 10.0% | 21.6% |
| Luis Medina | 1,960 | 44.3% | 10.1% | 22.7% |
| Luis Severino | 1,645 | 48.1% | 10.1% | 21.0% |
| Jordan Montgomery | 2,923 | 44.3% | 10.2% | 23.0% |
| Dane Dunning | 2,698 | 46.4% | 10.3% | 22.1% |
| Kyle Hendricks | 2,112 | 42.3% | 10.3% | 24.4% |
| Justin Steele | 2,684 | 49.1% | 10.5% | 21.3% |
| Steven Matz | 1,869 | 48.4% | 10.5% | 21.8% |
| Patrick Corbin | 2,925 | 44.6% | 10.6% | 23.7% |
| Braxton Garrett | 2,486 | 46.1% | 10.6% | 22.9% |
| Reese Olson | 1,745 | 42.9% | 11.1% | 25.9% |
| Zach Eflin | 2,581 | 47.5% | 11.2% | 23.5% |
| Kenta Maeda | 1,702 | 43.2% | 11.2% | 25.8% |
| Brady Singer | 2,615 | 47.5% | 11.2% | 23.6% |
| Bryce Elder | 2,852 | 42.0% | 11.4% | 27.1% |
| Colin Rea | 2,022 | 46.5% | 11.5% | 24.7% |
| Framber Valdez | 2,962 | 46.8% | 11.7% | 25.1% |
| Kyle Freeland | 2,419 | 48.6% | 12.0% | 24.7% |
| Chris Bassitt | 3,163 | 48.6% | 12.3% | 25.2% |
| Miles Mikolas | 3,198 | 51.7% | 13.3% | 25.8% |
| Connor Seabold | 1,567 | 50.4% | 15.3% | 30.3% |
