


Pablo López and Justin Steele are distinct in many ways. López is a righty with a five-pitch mix that’s headlined by a 95 mph heater. Steele is strictly a four-seamer/slider lefty, without the same, overpowering velocity at just under 92 mph. Steele surprised many after winning sixteen games for the Cubs on the back of a 3.06 ERA, 1.17 WHIP, and significantly reduced 5% walk rate, garnering him down-ballot Cy Young consideration. Conversely, López has long been a high-end starter (four straight seasons with a sub-3.80 ERA and sub-1.20 WHIP), and only recently unlocked his strikeout potential with a magnificent 29% clip in 2023. What has changed to allow these two disparate pitchers to reach another level of performance? For all of their differences, these two were great at two of the most important things a pitcher can do: throwing strikes and limiting dangerous contact.
Note: For the following analysis, I’m looking at all 2020-2023 individual seasons where a pitcher completed at least 30 innings pitched, unless otherwise indicated.
The Importance of Strikes
Strikes being “good” may seem obvious. Strikes are how you get a hitter out! Three can get you a strikeout and nine can get you through a whole inning. A hitter can’t get on base if you throw strikes by him. This is because strikes are important to a variety of helpful outcomes for the pitcher. You obviously need strikes to get strikeouts, so throwing more frequent strikes is a useful way to get there. Something that strike rate has an even stronger relation to, however, is walks: You can’t walk someone if you don’t throw any balls!


This has been proven in countless ways but is succinctly shown by the prevalence and usefulness of CSW. How often a pitcher throws strikes that aren’t hit is also a strong indicator of their underlying talent.
However, throwing strikes is not always a good thing. That’s where true danger lurks.
The Importance of Limiting Quality Contact
CSW outlines the pure positive aspects of strikes, while batted balls are the morally-grey twin of the strike family (a “Strike in Play”). Those strikes are a lottery of value: spin the batted ball luck wheel and see where you land! Popup? Congratulations! That’s an automatic out and is the best kind of strike! Line drive? Ouch! That’s a double to the wall that scored a runner. Or maybe it’s smacked straight to the right fielder for an out! Who knows! Batted balls contain multitudes.
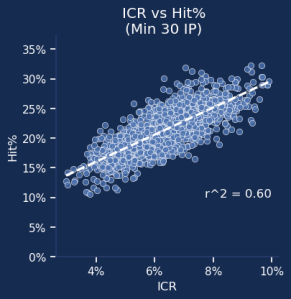
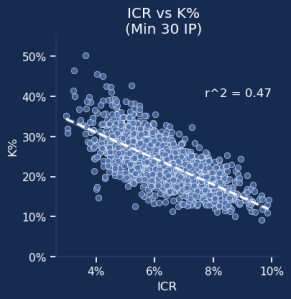
One way to pare down the variance of batted ball luck is to control for batted balls that are hit well. That’s where a metric like our very own ICR comes in handy. We define “Ideal Contact” as any batted ball that is classified as Barrel, “Solid”, or “Flare/Burner” (those classifications are explained here). We’re focusing on Ideal Contact Rate at the per-pitch level (unlike the article, which is per-BBE). This will penalize pitchers who throw more hittable balls (pitchers who throw more Mistakes), rather than only penalize pitchers who allow damage on contact, even if they don’t allow a lot of contact. Two of the immediate benefits of knowing ICR are that it is a very strong indicator of a pitcher’s per-pitch hit rate (more frequent ideal contact ~ more frequent hits) and it also has a fairly strong correlation to strikeout rate (less frequent ICR ~ more frequent Ks).
Two Great Tastes that Taste Great Together
Like chocolate and peanut butter, strike rate and ICR are two useful stats that go great together (I personally consider strike rate to be chocolate and ICR to be peanut butter, but you do you). This gets us to the purpose of this article: Str-ICR. By weighting and combining these two values, we can get a single stat that is more useful than both of them, individually. My simple weighting strategy was to estimate WHIP using strike rate and ICR and compare their coefficients. The ratio of their coefficients was roughly one part strike rate to negative two parts ICR, which is a nice, clean ratio I’m happy to use (if you want to get more detailed, the ratios were -1.15273 to 2.15273, since WHIP decreases as strike rate goes up and ICR goes down, but 1:-2 works just fine and gives us a metric that’s always a positive number). This gives us our formula:

It’s important to have context for what a given value means and viewing distributions can help. Viewed below, the average Str-ICR value is roughly 51%, while a very good (90th percentile) result is >=54.6%, and a very poor (10th percentile) result is <=47.1%. Let’s simplify this and outline that a Str-ICR 54% and above is Elite, while 47% and below is Poor.

Before venturing further, it’s important we run our nifty new metric through the Alexander Chase Checklist™ for all new baseball stats:
- What is it built to do?
- When can it be trusted?
- When does it break?
- How should it not be used?
What is it Built to Do?
Like Reese’s Peanut Butter Cups, Str-ICR is useful in various settings. Let’s first observe the relationship between strike rate, ICR, and Str-ICR, compared to K-BB%, that pillar of modern pitching analysis. We’ve previously established that strike rate and ICR both have benefits when looking at walk rate and strikeout rate, respectively, so Str-ICR should hopefully consolidate their strengths.
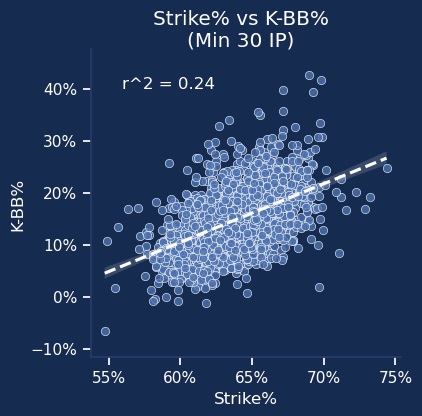


Sure enough, Str-ICR combines the benefits of both, more than doubling the r2 of either of its component stats. With a strong correlation with K-BB%, we can look at higher-level stats to see where some other uses can be. “A pitch-level stat for WHIP” was the initial pitch behind Str-ICR, which is how you end up with a stat that revolves around limiting balls and hard contact (and thus walks and hits, respectively). Let’s verify that Str-ICR does what it was built to do and that we have something that can approximate WHIP.

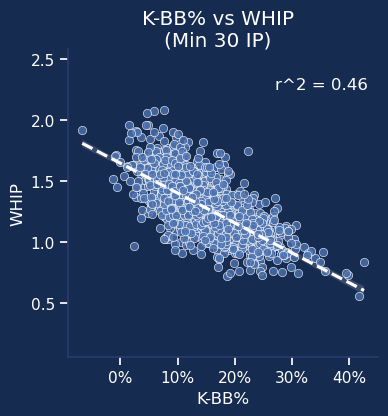
Str-ICR outperforms K-BB% in correlating to WHIP! That’s pretty impressive for a stat that has no “knowledge” of the outcomes of a plate appearance (like K-BB% does with… strikeouts and walks). I’m very pleased with that result and it shows that Str-ICR can serve as a functional pitch-level WHIP estimator. I’ll now step a bit outside of the scope of Str-ICR and take a look at two prominent ERA estimators: FIP and SIERA. I’m expecting K-BB% to be very strong here since both metrics directly incorporate strikeouts and walks.


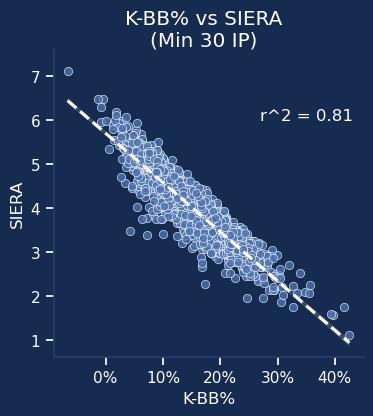
Str-ICR performs admirably, going toe-to-toe with K-BB% in its relation to FIP. It gets handily beaten by K-BB% when looking at SIERA, but it still fared better than it did against FIP (and it wasn’t too far from CSW’s correlation to SIERA, with an r2 of 0.64). In all, these are solid showings, considering that Str-ICR was optimized to relate to WHIP and not ERA or an ERA estimator.
When can it be Trusted?
Now that we know what Str-ICR’s useful for, it’s important to know when it can start to be used. I generally track the “when” part of a stat usage in two time frames: in-season, and season-to-season. I find the most useful stats are ones that stabilize in-season quickly and that are sticky from season to season. Starting with in-season, we can see that Str-ICR (1,400 pitches) takes slightly longer than strike rate to stabilize (1,300 Pitches, courtesy of Fangraphs; highlighted in green). That makes sense, given that ICR is a batted ball stat, and those can be fairly noisy, even at the pitch level.
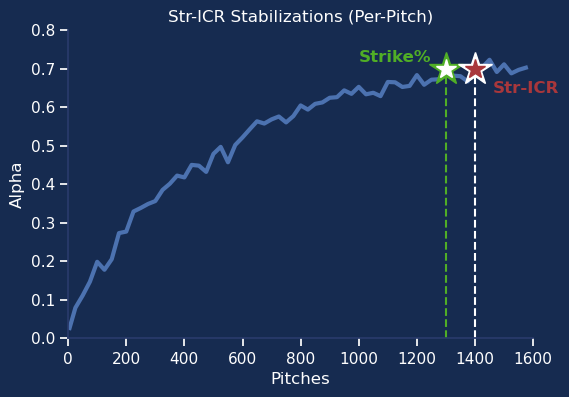
A sample of 1,400 pitches translates to ~84 IP at the MLB average of 16.6 pitches per IP. That’s solidly within a season for most starters, though it is out of reach for most relievers, especially those in high leverage. That isn’t to say Str-ICR can’t be helpful in fewer innings, but the results in smaller samples will be a bit noisier than I’d prefer. Moving on to season-to-season stickiness shows that Str-ICR has some staying power.
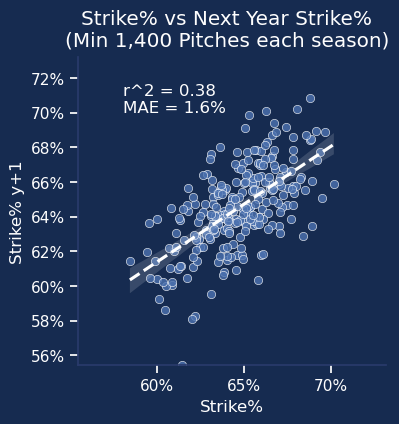
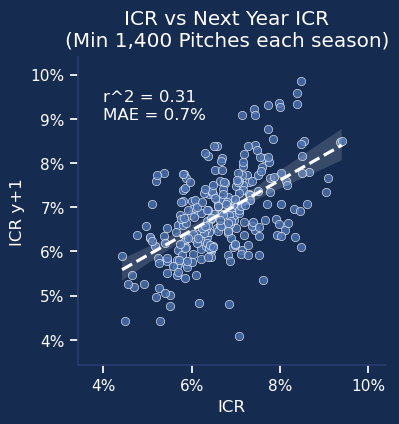

That’s fine with me. Being between its two component stats makes sense, and I don’t know that there would be much reason for improvement solely based on how you weigh them. A more interesting season-to-season usage is for WHIP. There’s a fairly straightforward way to convert Str-ICR to a WHIP estimator:
![]()
Using this gets to some interesting places. It maintains the 0.48 r2 that we saw with straight Str-ICR, while also being more predictive of next season’s WHIP than WHIP itself.

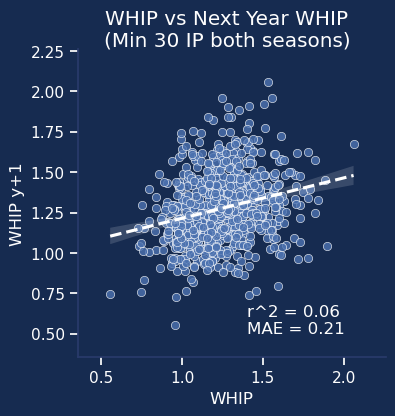
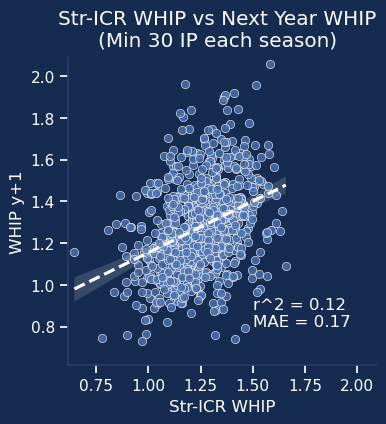
That isn’t much, but it at least provides a sanity check for a pitcher’s WHIP and can indicate if their WHIP isn’t lining up with their pitch-level results.
When does it break?
A straightforward answer would be “in less than 1,400 pitches”, but that isn’t fully true. It will be noisier, and not as stable before that 1,400 pitch threshold, but it can still be useful.
Something that will “break” Str-ICR is that it assumes a pitcher faces a league-average slate of hitters (in aggregate. They don’t have to all be exactly 100 wRC+ guys). If a pitcher faces a slate of atypically “easy” hitters (ex: AL Central pitchers) or “challenging ” hitters (ex: AL East pitchers or non-Atlanta NL East pitchers), then their Str-ICR rates will be partially influenced by the quality of the offenses faced. This is true of all pitching stats, but a batted ball-centric stat like ICR may be particularly prone to variations due to hitter quality.
Park and defense aren’t accounted for in this calculation. This was by design to maintain the simplicity of the calculation, but if a pitcher changes teams to some combination of a better or worse park and/or better or worse defense, then how their results relate to their Str-ICR will change. A smaller park will mean more of those ICR go for hits/HR, while a better defense will turn some of those batted balls into outs a little better. Park and defense will affect the outcomes of ICR significantly more than they will affect any strike rate changes.
As with most stats based on regression estimates, Str-ICR does better for the central portion of its population, at the expense of the extremes. Pitchers with extreme strike rate and/or ICR will have more noise when Str-ICR is used to estimate other stats, like WHIP.
How should it not be used?
I know I mentioned that Str-ICR does a (slightly) better job of predicting WHIP than WHIP, itself, but I would not use it as a straight WHIP projection or estimate. As I mentioned above, the Str-ICR WHIP estimate should be used as a sanity check for WHIP. If they don’t line up, that may be a useful flag to dig deeper into a pitcher’s results, to see if the difference is a skill issue or something else like luck/sequencing.
Even though it maintains a decent relationship with FIP & SIERA, Str-ICR should not be used as an ERA estimator. It was optimized for WHIP and there’s likely a better way to weight Strike% and ICR to represent ERA. We also have so many other stats that are better at estimating/describing ERA, and this doesn’t need to be one of them.
This is not an estimate of a pitcher’s Stuff, nor is it an estimate of their Command. Eno Sarris and co. have found that Stuff has a small, but not negligible, impact on inducing weak contact, so ICR may be influenced by Stuff, but it is at an indirect level. The same could likely be said of the relationship between Strike% and Command: there is likely some relation between the two, but it is not directly measured here. Poorly-located gas and solidly-located junk are both likely to sink a pitcher’s Str-ICR.
This should NOT be used as a holistic argument for whether a pitcher is “good” or not. There are many things a pitcher can do that make them a good/great pitcher, and some of those things are actively harmful to their Str-ICR. The biggest that comes to mind is Blake Snell’s purposefully low Zone% (to avoid Mistakes!). His strike rate will be very low as a result, but that’s by design, as he is more concerned with mitigating damage on batted balls (sure enough, he ran a league-low 5% ICR). That’s a strategic choice that isn’t fully rewarded by this particular stat.
Conclusion
We made it! Hopefully, I have given you an idea of the usefulness of combining a pitcher’s ability to throw strikes and/or avoid dangerous contact. Now you can see how two pitchers as seemingly opposite as Pablo López and Justin Steele can use the same skills to reach their next level of performance. Str-ICR will be on our player pages soon, but for now, here is the 2023 Str-ICR leaderboard for pitchers (min 1,500 Pitches). Enjoy!
| Pitcher | Pitches | Strike% | ICR | Str-ICR | WHIP | Str-ICR WHIP |
|---|---|---|---|---|---|---|
| Spencer Strider | 3,104 | 67.8% | 5.5% | 56.9% | 1.09 | 0.99 |
| Joe Ryan | 2,685 | 68.9% | 6.4% | 56.1% | 1.17 | 1.03 |
| George Kirby | 2,826 | 70.8% | 7.6% | 55.7% | 1.04 | 1.05 |
| Julio Urías | 1,854 | 68.5% | 6.6% | 55.2% | 1.16 | 1.07 |
| Zach Eflin | 2,581 | 68.8% | 6.9% | 55.1% | 1.02 | 1.07 |
| Bailey Ober | 2,327 | 66.8% | 5.8% | 55.1% | 1.07 | 1.08 |
| Pablo López | 3,032 | 67.1% | 6.1% | 55.0% | 1.15 | 1.08 |
| Max Scherzer | 2,469 | 66.3% | 5.7% | 54.9% | 1.12 | 1.09 |
| Kutter Crawford | 2,100 | 66.3% | 5.8% | 54.8% | 1.11 | 1.09 |
| Luis Castillo | 3,209 | 66.5% | 5.9% | 54.7% | 1.10 | 1.10 |
| Joe Musgrove | 1,562 | 66.0% | 5.8% | 54.4% | 1.14 | 1.11 |
| Shane McClanahan | 1,822 | 67.0% | 6.3% | 54.3% | 1.18 | 1.11 |
| Justin Steele | 2,684 | 67.6% | 6.8% | 54.0% | 1.17 | 1.13 |
| Logan Webb | 3,184 | 67.8% | 7.0% | 53.7% | 1.07 | 1.14 |
| Sean Manaea | 2,053 | 65.6% | 5.9% | 53.7% | 1.24 | 1.14 |
| Shohei Ohtani | 2,097 | 63.8% | 5.1% | 53.6% | 1.06 | 1.15 |
| Chris Sale | 1,672 | 65.3% | 5.9% | 53.6% | 1.13 | 1.15 |
| Tyler Glasnow | 1,903 | 65.4% | 5.9% | 53.5% | 1.08 | 1.15 |
| Aaron Nola | 3,095 | 67.2% | 6.8% | 53.5% | 1.15 | 1.15 |
| Sandy Alcantara | 2,728 | 68.7% | 7.7% | 53.4% | 1.21 | 1.16 |
| Griffin Canning | 2,182 | 65.0% | 6.0% | 53.1% | 1.24 | 1.17 |
| Chris Bassitt | 3,163 | 65.5% | 6.2% | 53.1% | 1.18 | 1.17 |
| Cole Ragans | 1,591 | 63.6% | 5.3% | 53.0% | 1.16 | 1.17 |
| Clayton Kershaw | 2,031 | 65.8% | 6.4% | 53.0% | 1.06 | 1.18 |
| Zack Wheeler | 3,158 | 65.5% | 6.3% | 53.0% | 1.08 | 1.18 |
| Justin Verlander | 2,605 | 65.5% | 6.3% | 52.9% | 1.13 | 1.18 |
| Nick Pivetta | 2,388 | 65.0% | 6.0% | 52.9% | 1.12 | 1.18 |
| Gerrit Cole | 3,287 | 66.0% | 6.6% | 52.8% | 0.98 | 1.19 |
| Kevin Gausman | 3,073 | 65.9% | 6.6% | 52.7% | 1.18 | 1.19 |
| Freddy Peralta | 2,840 | 62.8% | 5.1% | 52.7% | 1.12 | 1.19 |
| Logan Gilbert | 2,928 | 67.0% | 7.2% | 52.7% | 1.08 | 1.19 |
| Bobby Miller | 1,962 | 65.1% | 6.3% | 52.5% | 1.10 | 1.20 |
| Aaron Civale | 2,010 | 65.7% | 6.6% | 52.5% | 1.16 | 1.20 |
| Hunter Greene | 2,093 | 63.6% | 5.5% | 52.5% | 1.42 | 1.20 |
| Mitch Keller | 3,123 | 66.4% | 6.9% | 52.5% | 1.25 | 1.20 |
| Domingo Germán | 1,655 | 66.6% | 7.1% | 52.4% | 1.08 | 1.21 |
| Steven Matz | 1,869 | 65.1% | 6.5% | 52.2% | 1.33 | 1.22 |
| Michael King | 1,687 | 63.8% | 5.8% | 52.2% | 1.15 | 1.22 |
| Mike Clevinger | 2,105 | 65.6% | 6.7% | 52.2% | 1.23 | 1.22 |
| Eduardo Rodriguez | 2,449 | 65.3% | 6.6% | 52.1% | 1.15 | 1.22 |
| Grayson Rodriguez | 2,104 | 65.8% | 6.9% | 52.0% | 1.34 | 1.22 |
| Bryce Miller | 2,095 | 67.5% | 7.7% | 52.0% | 1.14 | 1.22 |
| Jon Gray | 2,403 | 66.0% | 7.0% | 52.0% | 1.29 | 1.22 |
| Colin Rea | 2,022 | 65.6% | 6.8% | 52.0% | 1.19 | 1.23 |
| Merrill Kelly | 2,814 | 64.6% | 6.3% | 51.9% | 1.19 | 1.23 |
| James Paxton | 1,692 | 64.4% | 6.3% | 51.9% | 1.31 | 1.23 |
| Corbin Burnes | 3,082 | 63.3% | 5.7% | 51.8% | 1.07 | 1.23 |
| Kyle Bradish | 2,642 | 63.9% | 6.1% | 51.7% | 1.04 | 1.24 |
| Tyler Wells | 1,907 | 64.0% | 6.1% | 51.7% | 0.99 | 1.24 |
| Clarke Schmidt | 2,716 | 65.2% | 6.8% | 51.7% | 1.35 | 1.24 |
| Nick Martinez | 1,756 | 64.4% | 6.4% | 51.5% | 1.26 | 1.25 |
| Taj Bradley | 1,822 | 65.4% | 6.9% | 51.5% | 1.39 | 1.25 |
| Jesús Luzardo | 2,995 | 64.1% | 6.3% | 51.5% | 1.21 | 1.25 |
| Alex Wood | 1,712 | 63.6% | 6.1% | 51.4% | 1.43 | 1.25 |
| Eury Pérez | 1,539 | 63.4% | 6.0% | 51.4% | 1.13 | 1.25 |
| JP Sears | 2,877 | 65.1% | 6.9% | 51.3% | 1.26 | 1.26 |
| Hunter Brown | 2,725 | 63.1% | 6.1% | 51.0% | 1.36 | 1.27 |
| Michael Wacha | 2,226 | 64.7% | 6.9% | 51.0% | 1.16 | 1.27 |
| Jameson Taillon | 2,534 | 65.9% | 7.5% | 50.9% | 1.28 | 1.28 |
| Andrew Heaney | 2,605 | 63.0% | 6.1% | 50.9% | 1.38 | 1.28 |
| Michael Lorenzen | 2,370 | 65.7% | 7.4% | 50.9% | 1.21 | 1.28 |
| Kenta Maeda | 1,702 | 64.4% | 6.8% | 50.9% | 1.17 | 1.28 |
| Edward Cabrera | 1,809 | 59.3% | 4.2% | 50.9% | 1.44 | 1.28 |
| Sonny Gray | 2,828 | 64.1% | 6.7% | 50.7% | 1.15 | 1.29 |
| Tanner Bibee | 2,328 | 63.5% | 6.4% | 50.7% | 1.18 | 1.29 |
| Yusei Kikuchi | 2,818 | 64.3% | 6.8% | 50.7% | 1.27 | 1.29 |
| Yu Darvish | 2,220 | 64.7% | 7.0% | 50.6% | 1.30 | 1.29 |
| Lance Lynn | 3,174 | 63.6% | 6.5% | 50.5% | 1.39 | 1.30 |
| Kyle Hendricks | 2,112 | 65.7% | 7.6% | 50.5% | 1.20 | 1.30 |
| Brayan Bello | 2,622 | 63.2% | 6.3% | 50.5% | 1.34 | 1.30 |
| Connor Seabold | 1,567 | 65.6% | 7.6% | 50.4% | 1.65 | 1.30 |
| Luis Severino | 1,645 | 66.0% | 7.8% | 50.4% | 1.65 | 1.30 |
| Reid Detmers | 2,610 | 63.8% | 6.7% | 50.3% | 1.35 | 1.30 |
| Graham Ashcraft | 2,327 | 64.7% | 7.2% | 50.3% | 1.37 | 1.31 |
| Seth Lugo | 2,378 | 65.1% | 7.4% | 50.3% | 1.20 | 1.31 |
| Andrew Abbott | 1,899 | 62.8% | 6.3% | 50.2% | 1.32 | 1.31 |
| Tanner Houck | 1,742 | 63.3% | 6.5% | 50.2% | 1.37 | 1.31 |
| Lucas Giolito | 3,207 | 63.1% | 6.5% | 50.2% | 1.31 | 1.31 |
| Reese Olson | 1,745 | 63.0% | 6.4% | 50.1% | 1.12 | 1.31 |
| Brandon Pfaadt | 1,614 | 65.7% | 7.9% | 50.0% | 1.41 | 1.32 |
| Cristian Javier | 2,886 | 61.7% | 5.9% | 50.0% | 1.27 | 1.32 |
| Braxton Garrett | 2,486 | 66.0% | 8.0% | 50.0% | 1.15 | 1.32 |
| MacKenzie Gore | 2,462 | 63.0% | 6.5% | 50.0% | 1.40 | 1.32 |
| Dane Dunning | 2,698 | 64.8% | 7.4% | 49.9% | 1.26 | 1.33 |
| Nathan Eovaldi | 2,235 | 62.9% | 6.5% | 49.9% | 1.14 | 1.33 |
| Logan Allen | 2,134 | 63.8% | 7.0% | 49.9% | 1.40 | 1.33 |
| José Berríos | 2,946 | 64.8% | 7.5% | 49.8% | 1.19 | 1.33 |
| Shane Bieber | 1,958 | 65.2% | 7.8% | 49.6% | 1.23 | 1.34 |
| Wade Miley | 1,876 | 62.9% | 6.7% | 49.6% | 1.14 | 1.34 |
| Jordan Montgomery | 2,923 | 64.2% | 7.3% | 49.5% | 1.19 | 1.34 |
| Framber Valdez | 2,962 | 63.6% | 7.1% | 49.4% | 1.13 | 1.35 |
| Drew Smyly | 2,406 | 63.1% | 6.9% | 49.3% | 1.43 | 1.35 |
| Martín Pérez | 2,233 | 63.6% | 7.2% | 49.3% | 1.40 | 1.35 |
| Alex Cobb | 2,514 | 63.8% | 7.3% | 49.2% | 1.32 | 1.36 |
| Miles Mikolas | 3,198 | 67.4% | 9.1% | 49.2% | 1.32 | 1.36 |
| Kodai Senga | 2,805 | 60.5% | 5.7% | 49.1% | 1.22 | 1.36 |
| Bryce Elder | 2,852 | 62.7% | 6.8% | 49.1% | 1.28 | 1.36 |
| Patrick Sandoval | 2,631 | 62.2% | 6.6% | 49.1% | 1.51 | 1.37 |
| David Peterson | 1,970 | 61.9% | 6.4% | 49.0% | 1.57 | 1.37 |
| Brandon Williamson | 1,942 | 63.5% | 7.3% | 49.0% | 1.28 | 1.37 |
| Zac Gallen | 3,253 | 64.5% | 7.7% | 49.0% | 1.12 | 1.37 |
| Rich Hill | 2,537 | 64.7% | 7.8% | 49.0% | 1.52 | 1.37 |
| Tony Gonsolin | 1,670 | 63.8% | 7.4% | 49.0% | 1.22 | 1.37 |
| Dylan Cease | 3,268 | 61.7% | 6.4% | 49.0% | 1.42 | 1.37 |
| Charlie Morton | 2,863 | 60.8% | 5.9% | 48.9% | 1.43 | 1.37 |
| Tyler Anderson | 2,437 | 63.5% | 7.3% | 48.9% | 1.49 | 1.38 |
| Dean Kremer | 2,933 | 63.6% | 7.4% | 48.8% | 1.31 | 1.38 |
| Josiah Gray | 2,817 | 61.2% | 6.2% | 48.8% | 1.46 | 1.38 |
| Ken Waldichuk | 2,559 | 61.6% | 6.4% | 48.8% | 1.56 | 1.38 |
| Ranger Suárez | 2,024 | 62.8% | 7.0% | 48.8% | 1.42 | 1.38 |
| Adrian Houser | 1,859 | 63.9% | 7.6% | 48.7% | 1.39 | 1.38 |
| Brady Singer | 2,615 | 63.9% | 7.6% | 48.6% | 1.45 | 1.39 |
| Johan Oviedo | 2,996 | 61.6% | 6.5% | 48.6% | 1.37 | 1.39 |
| Ryne Nelson | 2,359 | 64.5% | 7.9% | 48.6% | 1.42 | 1.39 |
| Jake Irvin | 2,150 | 62.2% | 6.8% | 48.6% | 1.42 | 1.39 |
| Marcus Stroman | 2,208 | 61.8% | 6.7% | 48.4% | 1.26 | 1.40 |
| Jordan Lyles | 2,821 | 63.0% | 7.3% | 48.4% | 1.24 | 1.40 |
| Blake Snell | 3,172 | 58.3% | 5.0% | 48.3% | 1.19 | 1.41 |
| Joey Wentz | 1,933 | 63.5% | 7.7% | 48.2% | 1.68 | 1.41 |
| Paul Blackburn | 1,880 | 61.1% | 6.5% | 48.0% | 1.54 | 1.42 |
| Taijuan Walker | 2,841 | 60.6% | 6.4% | 47.8% | 1.31 | 1.43 |
| Jack Flaherty | 2,638 | 61.3% | 6.9% | 47.6% | 1.58 | 1.44 |
| J.P. France | 2,206 | 62.3% | 7.4% | 47.5% | 1.36 | 1.44 |
| Xzavion Curry | 1,503 | 64.5% | 8.5% | 47.4% | 1.35 | 1.44 |
| Luis Medina | 1,960 | 60.5% | 6.6% | 47.3% | 1.51 | 1.45 |
| Zack Greinke | 2,222 | 64.3% | 8.5% | 47.3% | 1.27 | 1.45 |
| Luke Weaver | 2,260 | 63.1% | 8.0% | 47.1% | 1.58 | 1.46 |
| Kyle Gibson | 3,039 | 62.2% | 7.6% | 47.1% | 1.32 | 1.46 |
| Kyle Freeland | 2,419 | 65.6% | 9.3% | 46.9% | 1.47 | 1.47 |
| Javier Assad | 1,714 | 60.6% | 6.8% | 46.9% | 1.23 | 1.47 |
| Touki Toussaint | 1,596 | 58.6% | 5.9% | 46.8% | 1.45 | 1.48 |
| Trevor Williams | 2,629 | 61.4% | 7.4% | 46.6% | 1.60 | 1.48 |
| Michael Kopech | 2,432 | 58.1% | 5.8% | 46.5% | 1.59 | 1.49 |
| Anthony DeSclafani | 1,553 | 64.0% | 8.8% | 46.4% | 1.25 | 1.50 |
| Alek Manoah | 1,700 | 60.4% | 7.1% | 46.1% | 1.74 | 1.51 |
| Cal Quantrill | 1,714 | 61.7% | 7.9% | 45.8% | 1.46 | 1.52 |
| Tylor Megill | 2,237 | 60.2% | 7.3% | 45.5% | 1.58 | 1.54 |
| Austin Gomber | 2,167 | 63.8% | 9.2% | 45.4% | 1.49 | 1.54 |
| Chris Flexen | 1,755 | 62.6% | 8.8% | 45.1% | 1.67 | 1.56 |
| Carlos Carrasco | 1,593 | 61.8% | 8.4% | 44.9% | 1.70 | 1.56 |
| Patrick Corbin | 2,925 | 61.5% | 8.5% | 44.5% | 1.48 | 1.58 |
| Zach Davies | 1,501 | 58.6% | 7.6% | 43.4% | 1.66 | 1.64 |
| Adam Wainwright | 1,793 | 60.9% | 9.3% | 42.3% | 1.90 | 1.69 |
