


Pitching is really hard. I know that’s the kind of hard-hitting analysis that you come to me for, but it’s important to lead with that fact. Pitchers need to locate a nearly 3-inch wide baseball somewhere within a roughly 2.5 square foot box that’s about 54 feet away when they release the pitch, which is also moving up to 24″ in any given direction (before we factor in how gravity affects the pitch). That’s really hard! I can’t make a crumpled-up piece of paper into the trash can 2 feet away from me, so I have a lot of respect for anyone who can even get a pitch in the same zip code as the strike zone. This post, however, focuses on the pitches that aren’t in the same zip code. We’re going to dive into pitches that are far enough from the zone that hitters don’t even need to think about swinging (Non-Competitive Pitches), and specifically how frequently they’re thrown: the Non-Competitive Pitch Rate (NC% or NC Rate).
Note: For the following analysis, I’m looking at all 2021-2025 individual seasons where a pitcher completed at least 100 innings pitched, unless otherwise indicated.
Defining A “Non-Competitive Pitch”
A competitive pitch is one where the hitter is challenged and has to make a split-second decision to swing or not. This doesn’t mean that the pitch has to be in the zone, though. Well-executed fastballs can be located above the zone and still earn swings, while breaking pitches out of the strike zone can cause some highlight-worthy hacks. Even the count has an impact on those swing decisions: a hitter with a 3-0 count is much less likely to swing at a pitch marginally out of the zone, because there’s a non-zero chance that’s a free pass to first base. That same hitter might expand a bit in 2-strike counts, because they can’t risk getting beat on a pitch that might be called a strike.
Another factor worth considering is that a pitch’s physical characteristics also influence whether a pitch is competitive: faster pitches give the hitter less time to react, so they tend to swing at a wider array of locations. Outlier movement can also expand a hitter’s zone: Tyler Glasnow has a 30+” difference in induced vertical break between his Four-Seam and Curveball. That’s a lot of movement space for a hitter to cover! Graham Ashcraft gives a hitter a much smaller window of movement to consider (<12″ of vertical separation between his Cutter and Slider), so where he locates is much more important.
Our PLV model considers these pitch characteristics (velo, movement, separation from fastball, and location), and provides outputs for each outcome a pitch can have (whiff, ball, foul, double, etc). The league-average PLV likelihood of a pitch being a ball or a hit-by-pitch was 35.8% (actual MLB results were 35.9%, so the model is solidly calibrated there). The distribution of those likelihoods is what I find interesting.
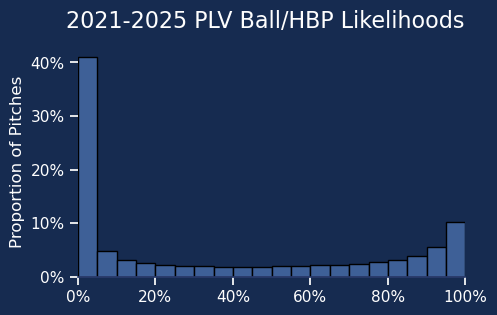
The plurality of pitches have a <5% likelihood of being a ball/hit-by-pitch. This makes sense, as nearly half of all pitches are located in the “rulebook strike zone”. Since PLV is trained on results (which include things like umpire tendencies and catcher framing), the PLV likelihood of being a ball for a pitch in the zone is anywhere from 0-10%, with the average being 2.6%. At the opposite end of the spectrum, we have our Non-Competitive pitches. Roughly 10% of all pitches were at least 95% likely to either be a ball or a hit-by-pitch. These are the pitches where the decision to swing is obvious: you let it go by. These pitches should always be taken, and they generally are.
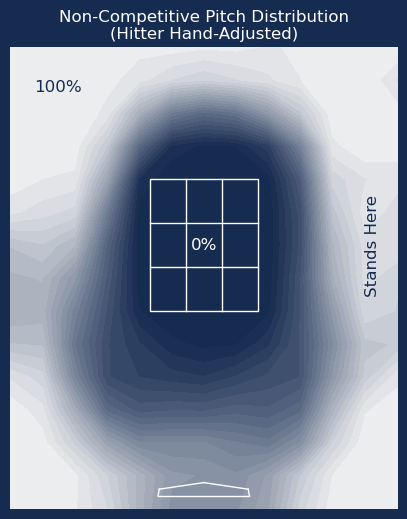
In that location chart, you can see that pitches in the zone have a 0% rate: they’re always competitive, because they’re going to be strikes if they aren’t swung at. As you move away from the zone, the likelihood of a pitch not being competitive goes up. Pitches close to the zone can still be non-competitive due to either count effects or the pitch having poor stuff. Pitches down and/or away have more wiggle room, because hitters tend to chase those pitches more often (even if they aren’t necessarily close to the plate).
NC Rate By Pitch Type
With an idea of what a NC pitch is, we can now start to analyze different pitch types. There is a general trend for pitch types: breaking pitches have low NC rates, offspeed pitches are average, and fastballs run high NC rates.
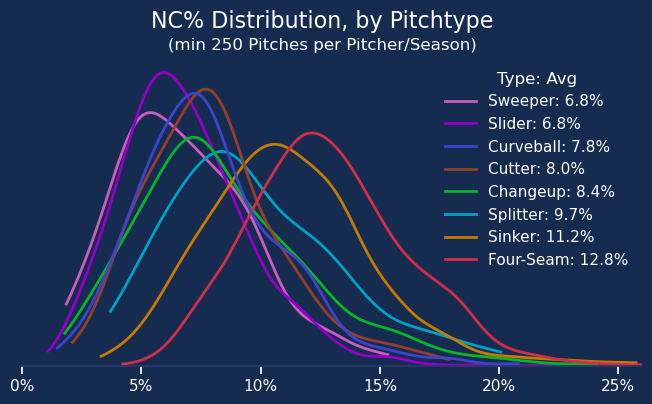
There is likely count leverage involved there (pitches that are more commonly used when the pitcher is behind, like fastballs, will likely have a more compact zone/competitive pitch space to work with), though these trends are broadly similar in 0-0 counts, where there’s no count leverage yet. This pattern also fits broader league behaviors vs pitch types (For example: Hitters chase secondaries more often than fastballs).
A secondary consideration is the overall “stuff” of a pitch, which I shorthand to whiffs and damage on contact. Secondary pitches yield more whiffs and a lower wOBAcon than fastballs. This makes sense as, as their name suggests, these are secondary pitches. A hitter is usually expecting a fastball most often, and it follows that the expected pitches would yield better results for the hitter. That doesn’t mean every pitcher should do away with fastballs entirely (though I do love a good breaker-first pitch mix), just that pitchers don’t have as high a margin for error with them.
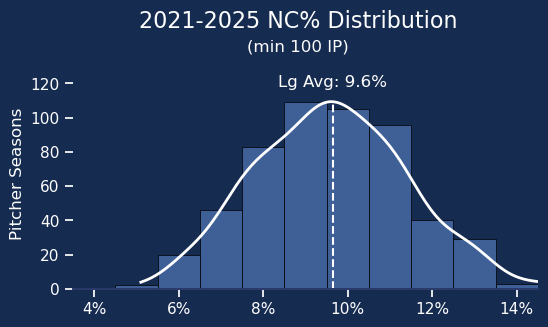
It is important to remember these intertwined count and type biases to contextualize a pitcher’s overall NC%, as how they deploy their repertoire will have an effect on their overall value. At the repertoire level, NC% is somewhat normally distributed, around a league average of 9.6%. A table of starters from this season (min 1,500 pitches thrown) can be found at the end of the article.
What Is The Impact Of NC Pitches?
I’m glad you asked! Besides the narrative benefits of quantifying a vague baseball concept (“That pitch wasn’t competitive”), there are a few trends that this stat has revealed.
- NC pitches are extremely hurtful to pitchers. This makes sense as they are almost always balls (or worse, a hit-by-pitch), which is a bad outcome for the pitcher. In 2025, there are roughly 148 pitches per team in a full 9-inning game. The average PLV run values for non-NC pitches (2021-2025) would return a 3.06 ERA (compared to a league average estimate of 4.14), so an average pitcher dropping NC pitches would drop over a 1 full run of ERA.
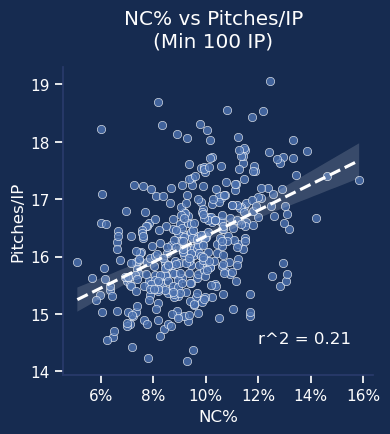
- Pitchers with a higher NC% are less efficient with their pitch counts in games. This is pretty intuitive, as each NC pitch is, by default, adding a pitch to their pitch count. The problem is these pitches so rarely help the pitcher, and are frequently making the current plate appearance more challenging (or ending it with the hitter on first). There’s a small correlation between season-long NC% and Pitches per IP. The correlation isn’t as strong as something like Ball%, but this is a much smaller and stricter subset of that stat. NC pitches will typically only affect 1-2 pitches per IP.
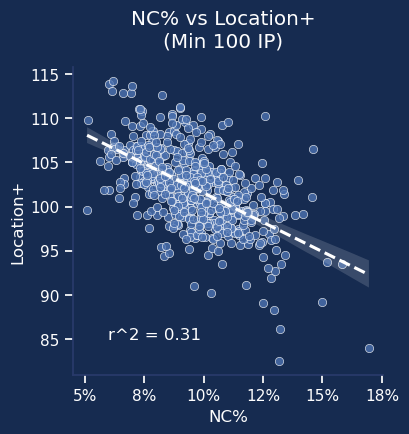
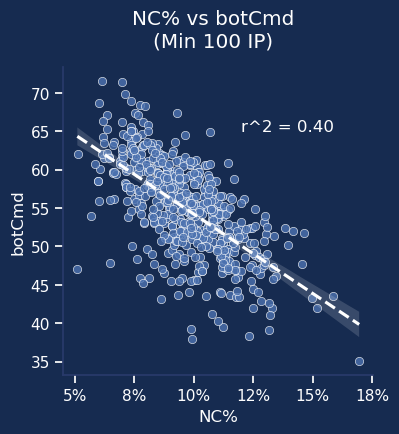
- NC% tracks decently well with more complex public Location-value models, like Location+ and Pitching Bot’s botCmd (both of which can be found at FanGraphs). It’s interesting that a small sample of pitches can match up well with full-scale models that use the entirety of a pitcher’s season and are weighted for impact on Run Value. Since NC% technically considers stuff characteristics, I also compared to the Pitching+ (r2 of 0.16) & botOvr (r2 of 0.25) models. Those have weaker relationships, because NC% puts such a heavy emphasis on location. It’s generally focusing on such outlier spots that stuff has a small (but still non-zero) impact. It makes sense that NC% behaves more similarly to the location-only models.
- Pitchers zone the following pitch 5% more than they otherwise would. This effect is likely due to the count being less pitcher-friendly so they need a strike, but I’ve heard broadcasts mention that a pitcher needs to “re-establish the strike zone”, and this may be some of that, too.
- Hitters are more aggressive after NC pitches. We have a PLV-derived hitter metric, Swing Aggression, that measures how often a hitter swings at a pitch, relative to the PLV expected swing rate. The expected rate considers the characteristics of the pitch, which notably includes count and location. Even when you control for the qualities of the pitch, hitters swing at the pitch following a NC pitch a full 2% more often than expected.
I’m writing this here to remind future me to research more: there are also varying hitter approaches to pitches following a NC pitch. While the league is normally distributed around that +2% Swing Aggression value, the otherwise mild-mannered Austin Hays (+0.4% Swing Aggression in 2025) becomes hyper-aggressive after a NC pitch (+21.7% Swing Aggression), while the generally passive Chase Meidroth (-8.8% Swing Aggression in 2025) functionally doesn’t take the bat off his shoulder following a NC pitch (-19.8% Swing Aggression).
When Does NC Rate Stabilize?
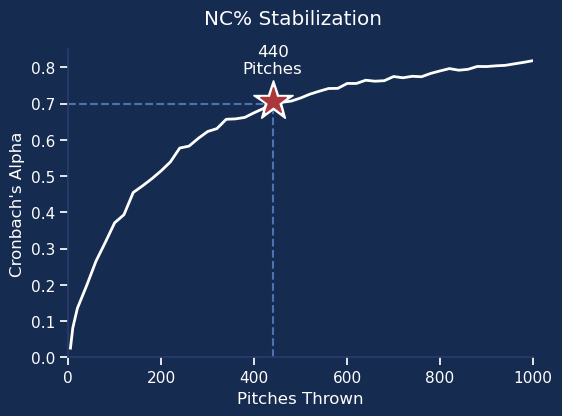
A quick-stabilizing stat can be useful midseason, both to identify previously unheralded players, or to identify talent changes mid-season. NC% falls just inside what I would consider “quick”, by stabilizing after ~440 pitches. That matches the stabilization rate for other pitch-modelling metrics that incorporate location. Pitchers are averaging roughly 16.5 pitches per inning in 2025, which translates to NC% stabilizing after ~26.5 IP, or about 5 starts.
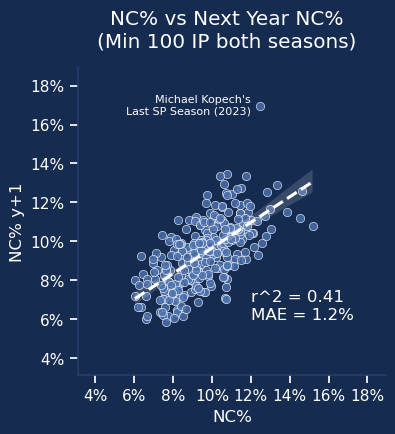
That’s plenty of time to analyze midseason callups, relievers, or pitchers before and after a midseason injury. The results are fairly sticky year-to-year as well (r2 of 0.41), falling right in the middle of the previously mentioned location models (Location+ was 0.31; botCmd was 0.52), so this does a solid job of showcasing a pitcher’s talent at consistently throwing competitive pitches.
When Does NC Rate Break?
This isn’t a great measure of judging how competitive a pitcher’s pitches are in a vacuum. I’ve already mentioned a few ways context influences NC%. If a pitcher faces a disproportionate percentage of pitcher- or hitter-friendly counts, then the location space that is considered “competitive” will change. Different pitch types also have location spaces that are or aren’t competitive. High- or low-quality stuff (velo/movement/release traits) provides a 3rd variable that will affect competitiveness. All of those things affect the hitter’s behavior.
Comparing across pitch types is not recommended, for the reason mentioned above. At the very least, you should look at NC% relative to an average pitch of that type.
NC Rate Is Not Perfect
Even though it logically flows from Ball%, NC% is not a great measure of BB%. As previously mentioned, roughly 1-2 pitches in an inning will be NC pitches, which would need to occur with 3 balls in the count to have an impact. If a pitcher spikes a 0-0 Curve or a 1-2 Four-Seam, that can be redeemed.
This is not a holistic measure of a pitcher’s abilities, whether that means their ability to locate or their ability to throw quality pitches. There are other metrics explicitly designed for that (like the location models I’ve mentioned above or our very own PLV model).
This is not a statement about how competitive the pitchers themselves are. To be a major leaguer, you have to have 80-grade Dawg-in-You. These are elite athletes. They are all hyper-competitive.
Conclusion
We made it! We now have a measure for how often pitchers are wasting their pitches by locating them in non-competitive locations. We now have a data-driven measure to classify individual pitches, in a way that gives some information about their ability to be efficient and earn value from their locations. Maybe we should pair it with a measure for bad pitches that are thrown in the zone…
Note: This NC% Leaderboard will be updated as a Google Sheet exclusively for PL Pro members. NC% by pitch type and exploration with MTK% and Stuff+ is included as well.
Save $40 on PL Pro Yearly with promo code: NCRATE40 – Get PL Pro Today!
